Self-Hosted Infrastructure Lab
Project Overview
This project is a self-hosted infrastructure lab built on an Ubuntu Server virtual machine. The goal was to create a realistic internal DevOps environment with containerized services, reverse proxy routing, monitoring, centralized logging, dashboards, and automated alerting.
The environment runs locally inside a virtual machine on my Mac and is only available inside my local network. It is not exposed to the public internet. This makes it a safe and controlled lab for practicing Linux administration, Docker operations, monitoring, alerting, and infrastructure documentation.
The final result is a compact but realistic internal platform that includes:
- Docker-based service hosting
- Web-based Docker management
- Reverse proxy routing
- Local HTTPS support
- Self-hosted Git platform
- Self-hosted password manager
- Uptime monitoring
- Metrics monitoring
- Container monitoring
- Centralized log collection
- Discord alert notifications
- A central homepage dashboard for all services
This project is best described as a Self-Hosted DevOps Infrastructure Lab with Security Monitoring Features.
Project Goal
The goal was to build a practical infrastructure lab that behaves like a small internal company platform.
Instead of only installing tools separately, the project connects them into one environment:
- Services are deployed as Docker containers.
- Nginx Proxy Manager routes traffic to internal services.
- Homepage provides one central dashboard.
- Prometheus collects metrics.
- Grafana visualizes metrics and manages alerts.
- Node Exporter exposes host metrics.
- cAdvisor exposes Docker container metrics.
- Loki stores logs.
- Promtail ships logs to Loki.
- Discord receives alert notifications.
The purpose was to learn how modern infrastructure is operated, monitored, and maintained.
Architecture Summary
The infrastructure is based on one Ubuntu Server VM.
MacBook Host
└── Ubuntu Server VM (infra-lab)
    ├── Docker Engine
    ├── Portainer
    ├── Nginx Proxy Manager
    ├── Homepage
    ├── Gitea
    ├── Vaultwarden
    ├── Uptime Kuma
    ├── Prometheus
    ├── Grafana
    ├── Node Exporter
    ├── cAdvisor
    ├── Loki
    └── Promtail
Main VM details:
| Item | Value |
|---|---|
| Hostname | infra-lab |
| Operating System | Ubuntu Server |
| IP Address | 192.168.64.4 |
| Runtime | Docker |
| Access | Local network only |
| Reverse Proxy | Nginx Proxy Manager |
| Dashboard | Homepage |
Implemented Services
| Service | Purpose | Port / URL |
|---|---|---|
| Portainer | Docker management | https://192.168.64.4:9443 |
| Nginx Proxy Manager | Reverse proxy | http://192.168.64.4:81 |
| Homepage | Central dashboard | http://192.168.64.4:3000 |
| Gitea | Self-hosted Git | http://192.168.64.4:3002 |
| Vaultwarden | Password manager | https://vault.home |
| Uptime Kuma | Availability monitoring | http://192.168.64.4:3001 |
| Prometheus | Metrics collection | http://192.168.64.4:9090 |
| Grafana | Dashboards and alerts | http://192.168.64.4:3010 |
| Node Exporter | Host metrics | http://192.168.64.4:9100/metrics |
| cAdvisor | Container metrics | http://192.168.64.4:8081 |
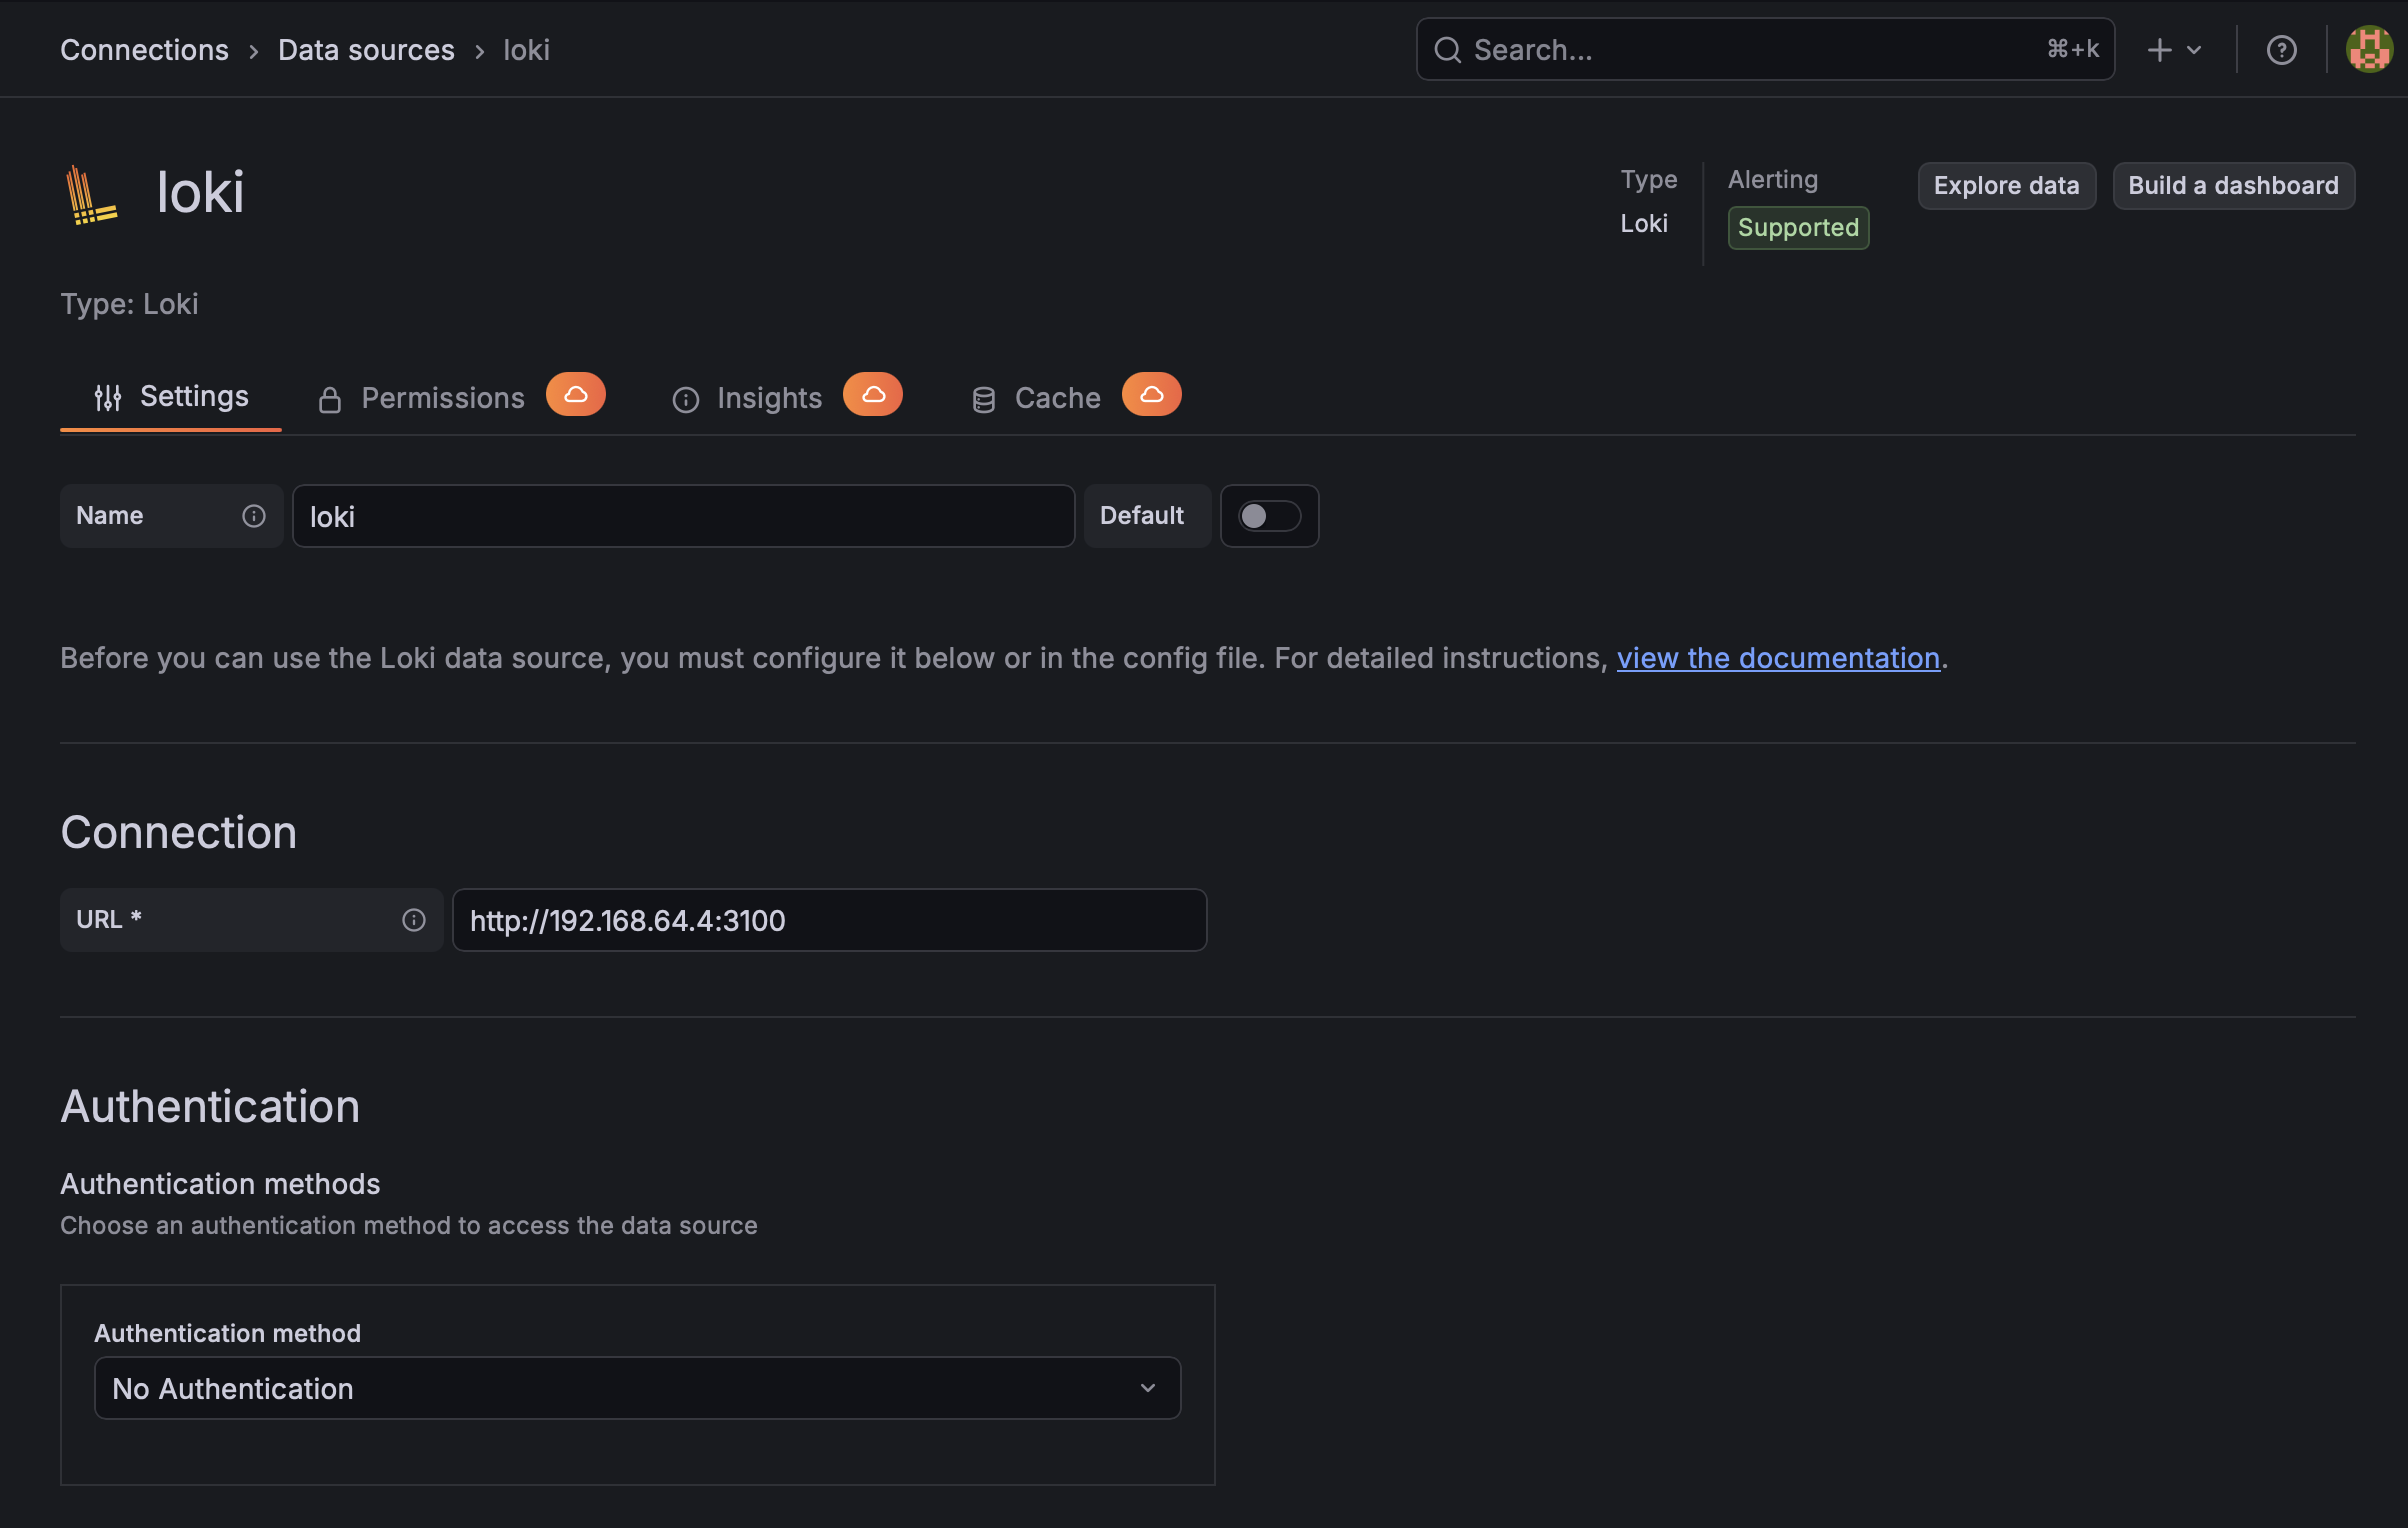
| Loki | Log storage | http://192.168.64.4:3100 |
| Promtail | Log shipping agent | Internal service |
Network and Access Model
The lab is intentionally internal only.
Services are accessed through:
- Direct local IP and port
- Internal
.homehostnames - Reverse proxy routes
Examples:
http://192.168.64.4:3010
https://vault.home
http://gitea.home
http://npm.home
The .home names are resolved locally through entries in the Mac hosts file.
This keeps the project safe because no services are exposed publicly.
Ubuntu Server VM
The foundation of the lab is an Ubuntu Server VM.
Ubuntu Server was chosen because it is widely used, stable, lightweight, and commonly used in real infrastructure environments.
The VM provides:
- Linux server administration practice
- A dedicated environment for Docker
- A controlled network target for monitoring
- A realistic server setup for portfolio documentation
After installation, the server was configured with a user account, network access, Docker, and several containerized services.
Docker as the Runtime Platform
Docker is the main runtime platform for the project.
Instead of installing every application directly on the operating system, each tool runs inside its own container.
This has several advantages:
- Services are isolated from each other.
- Deployments are repeatable.
- Containers can be stopped, started, updated, and removed easily.
- Volumes keep persistent data separate from containers.
- Docker Compose makes service configuration easier.
Docker is used for all major services in the lab:
Portainer
Nginx Proxy Manager
Homepage
Gitea
Vaultwarden
Uptime Kuma
Prometheus
Grafana
Node Exporter
cAdvisor
Loki
Promtail
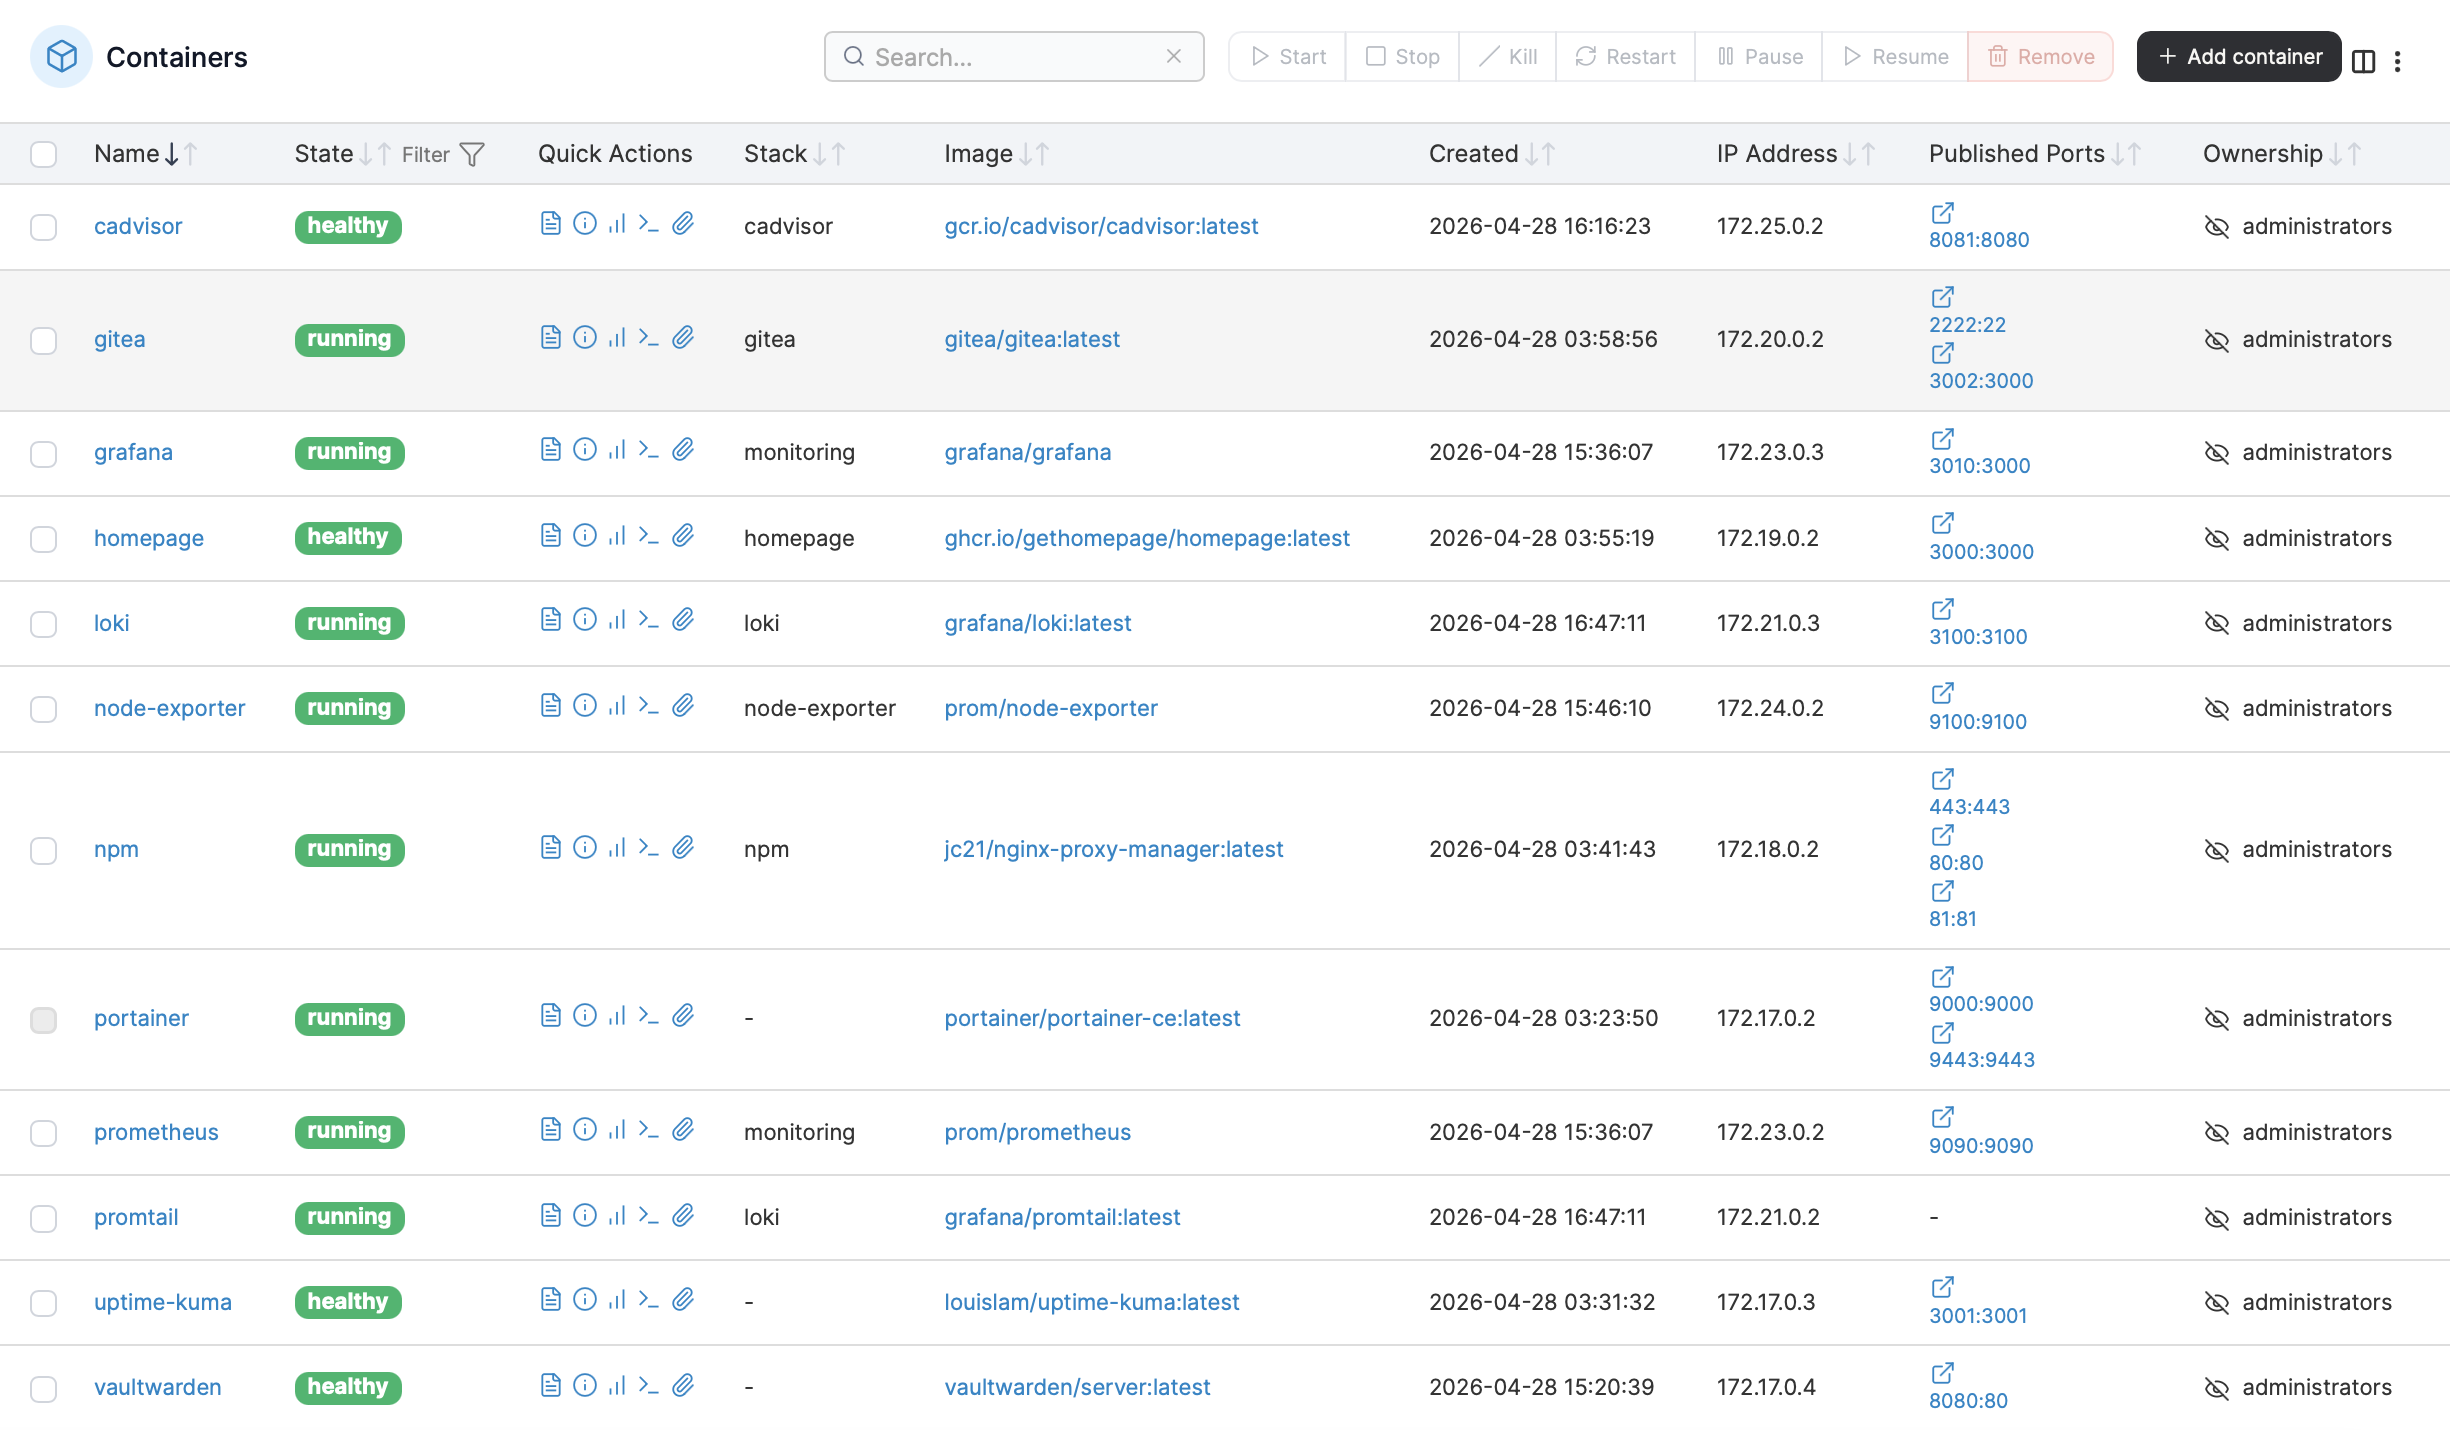
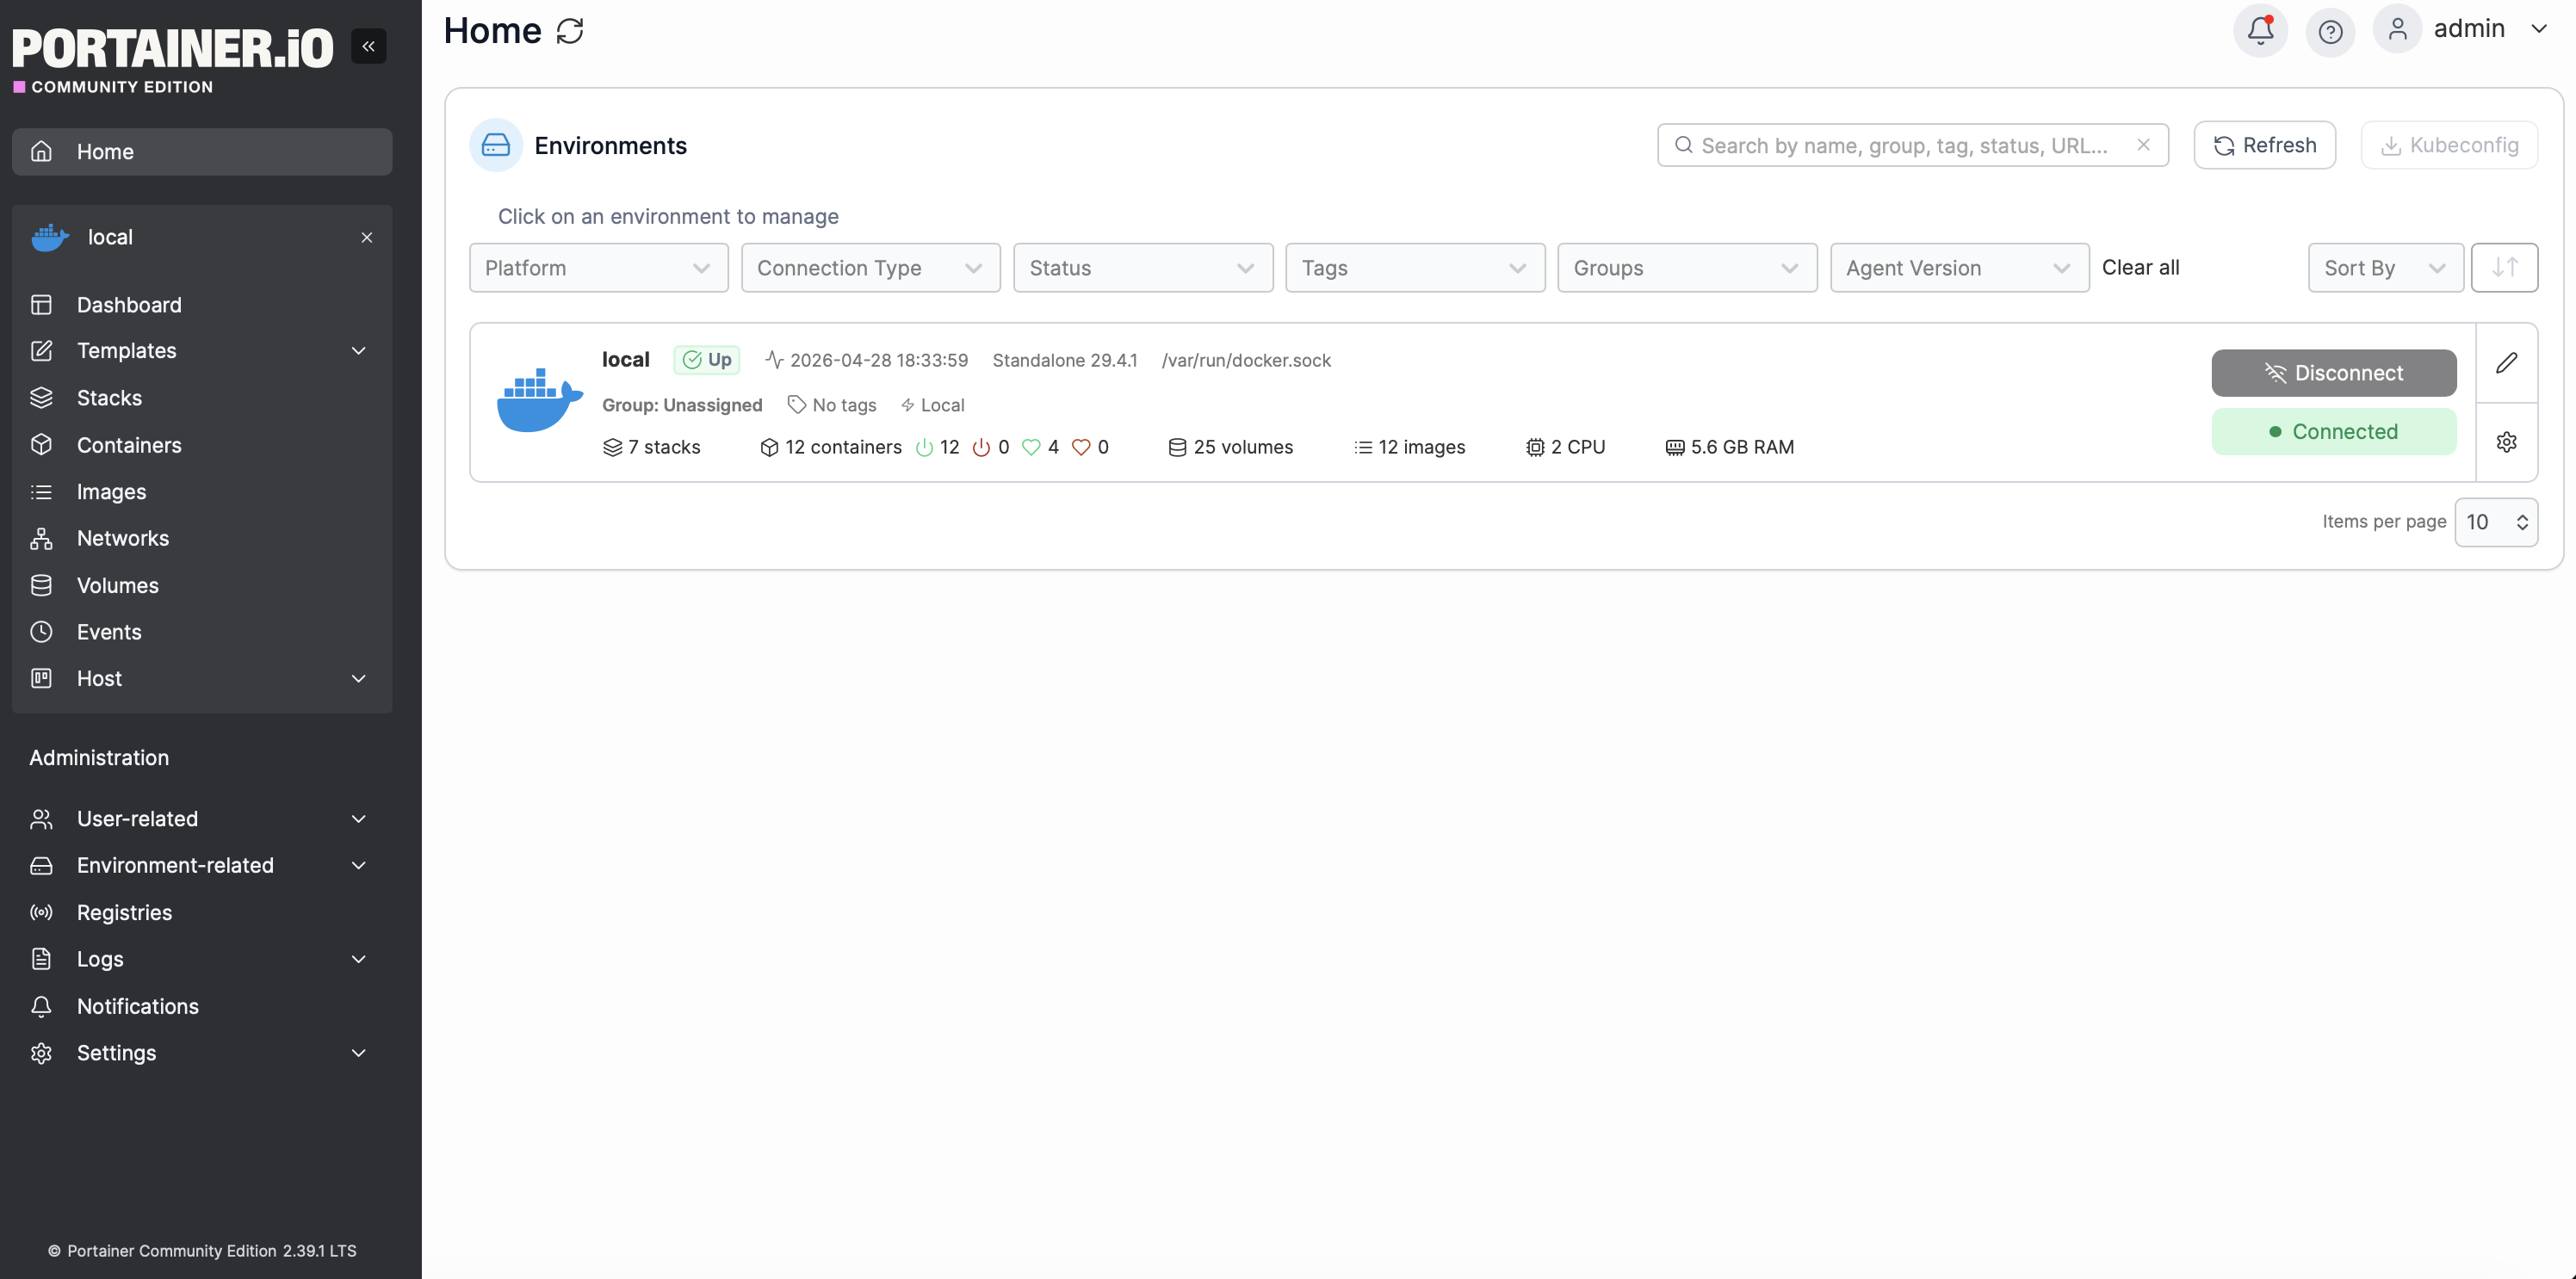
Portainer
Portainer was installed as a web-based Docker management interface.
Its purpose is to make Docker easier to manage and inspect.
With Portainer, I can view:
- Running containers
- Container health
- Images
- Volumes
- Networks
- Logs
- Stacks
This is useful because it gives a clear overview of the container environment without needing to run Docker commands for every check.
Portainer is especially helpful when managing multiple services because it provides a central place to inspect container status.
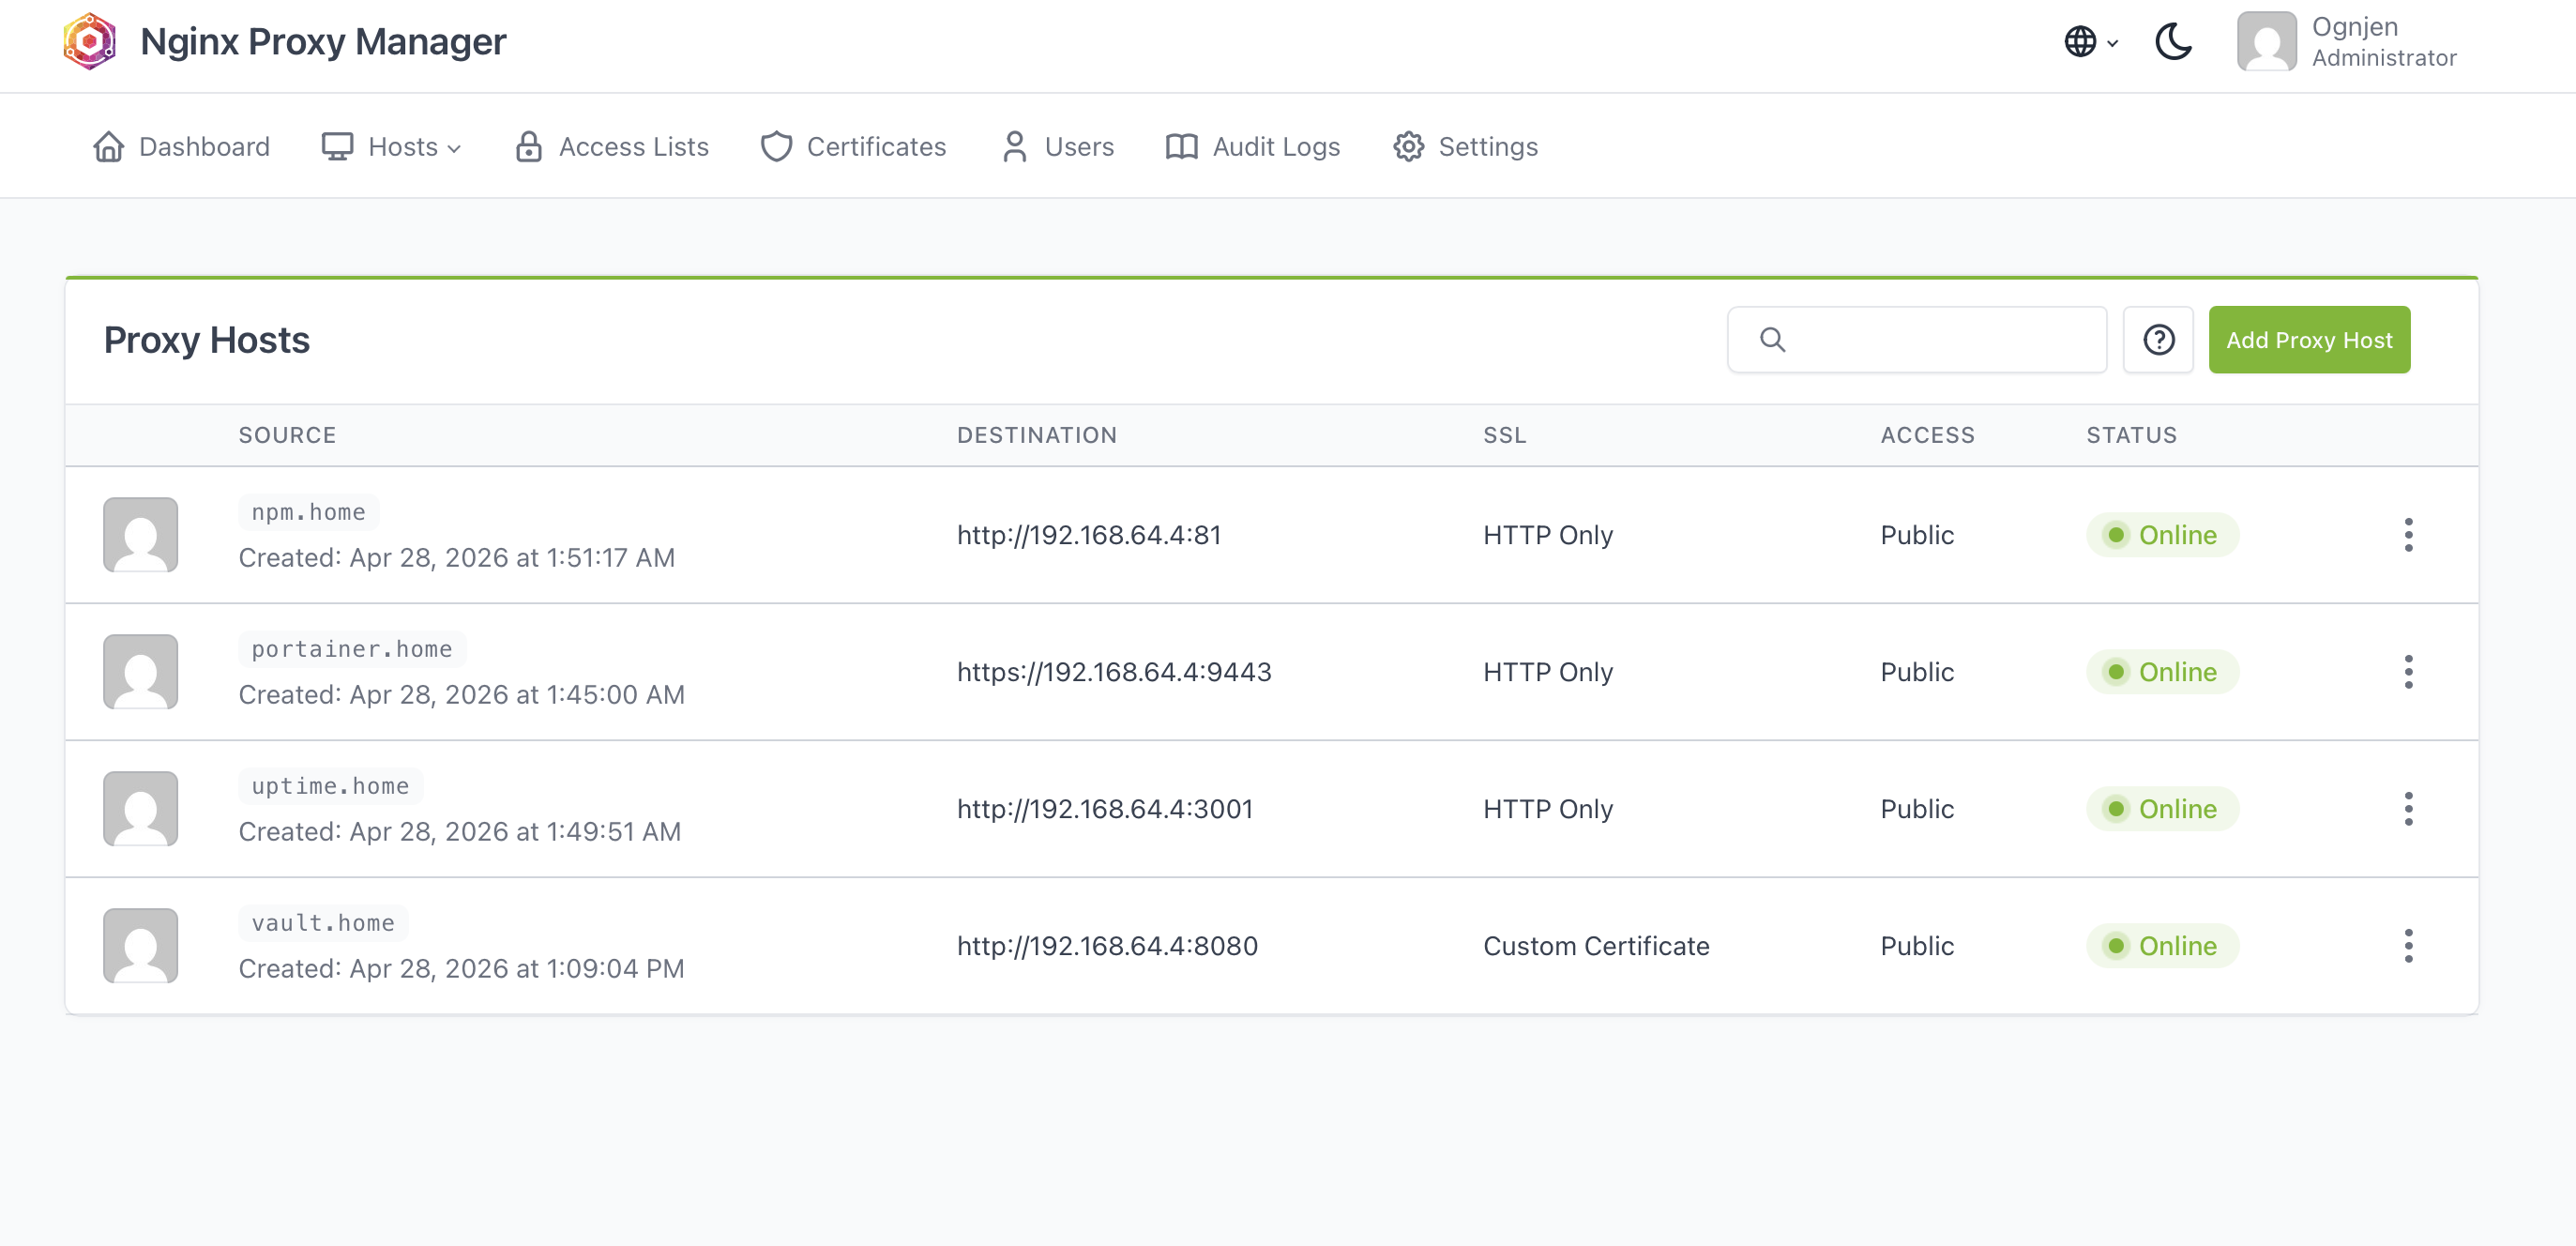
Nginx Proxy Manager
Nginx Proxy Manager was installed to manage reverse proxy routes through a web interface.
A reverse proxy sits in front of internal services and forwards requests to the correct container or port.
Without a reverse proxy, services are accessed like this:
192.168.64.4:9443
192.168.64.4:3001
192.168.64.4:8080
With a reverse proxy, services can be accessed with cleaner names:
vault.home
gitea.home
npm.home
This makes the infrastructure easier to use and closer to real company setups.
Nginx Proxy Manager was also used together with locally trusted certificates for HTTPS access to Vaultwarden.
Local DNS with Hosts File
Because this lab is internal and does not use public DNS, local hostnames were added to the Mac hosts file.
Example entries:
192.168.64.4 vault.home
192.168.64.4 gitea.home
192.168.64.4 npm.home
This makes the Mac resolve these names to the Ubuntu VM.
This is a simple but effective way to simulate internal DNS in a homelab.
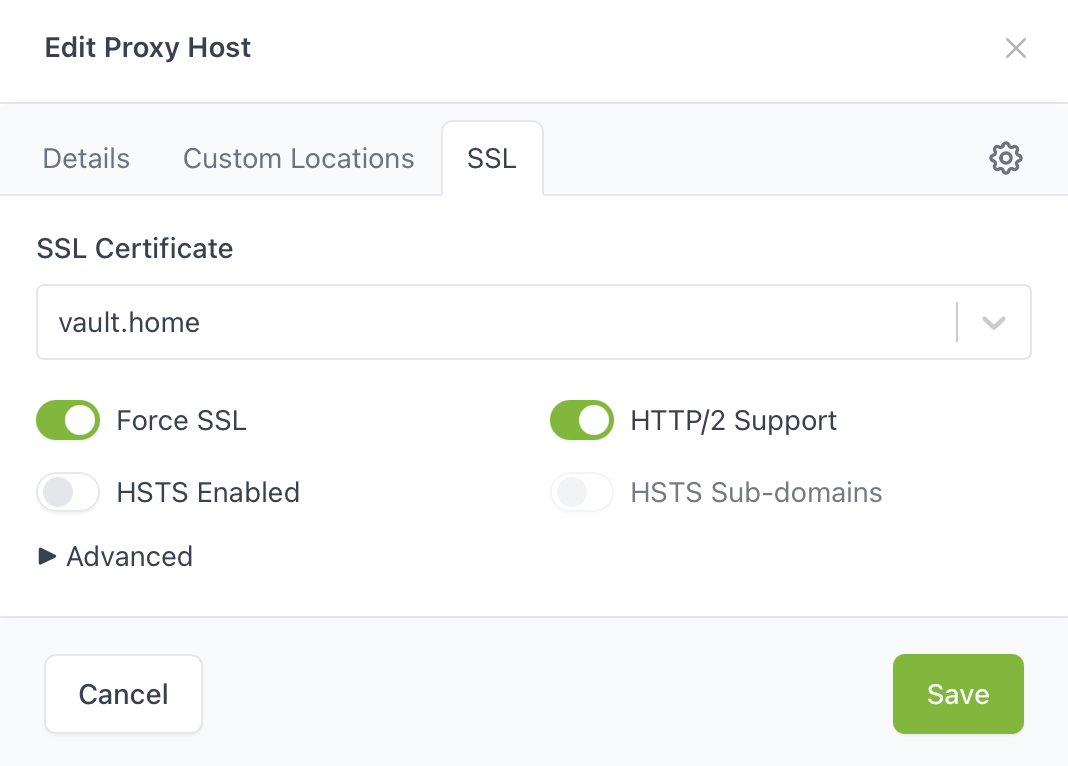
Local HTTPS with mkcert
Vaultwarden requires HTTPS for browser cryptographic functions.
At first, Vaultwarden showed a browser warning because it was not running in a secure context.
To solve this, mkcert was used to generate locally trusted certificates.
These certificates were then imported into Nginx Proxy Manager as a custom certificate.
This allowed Vaultwarden to work correctly at:
https://vault.home
This step was important because password managers should not run over plain HTTP.
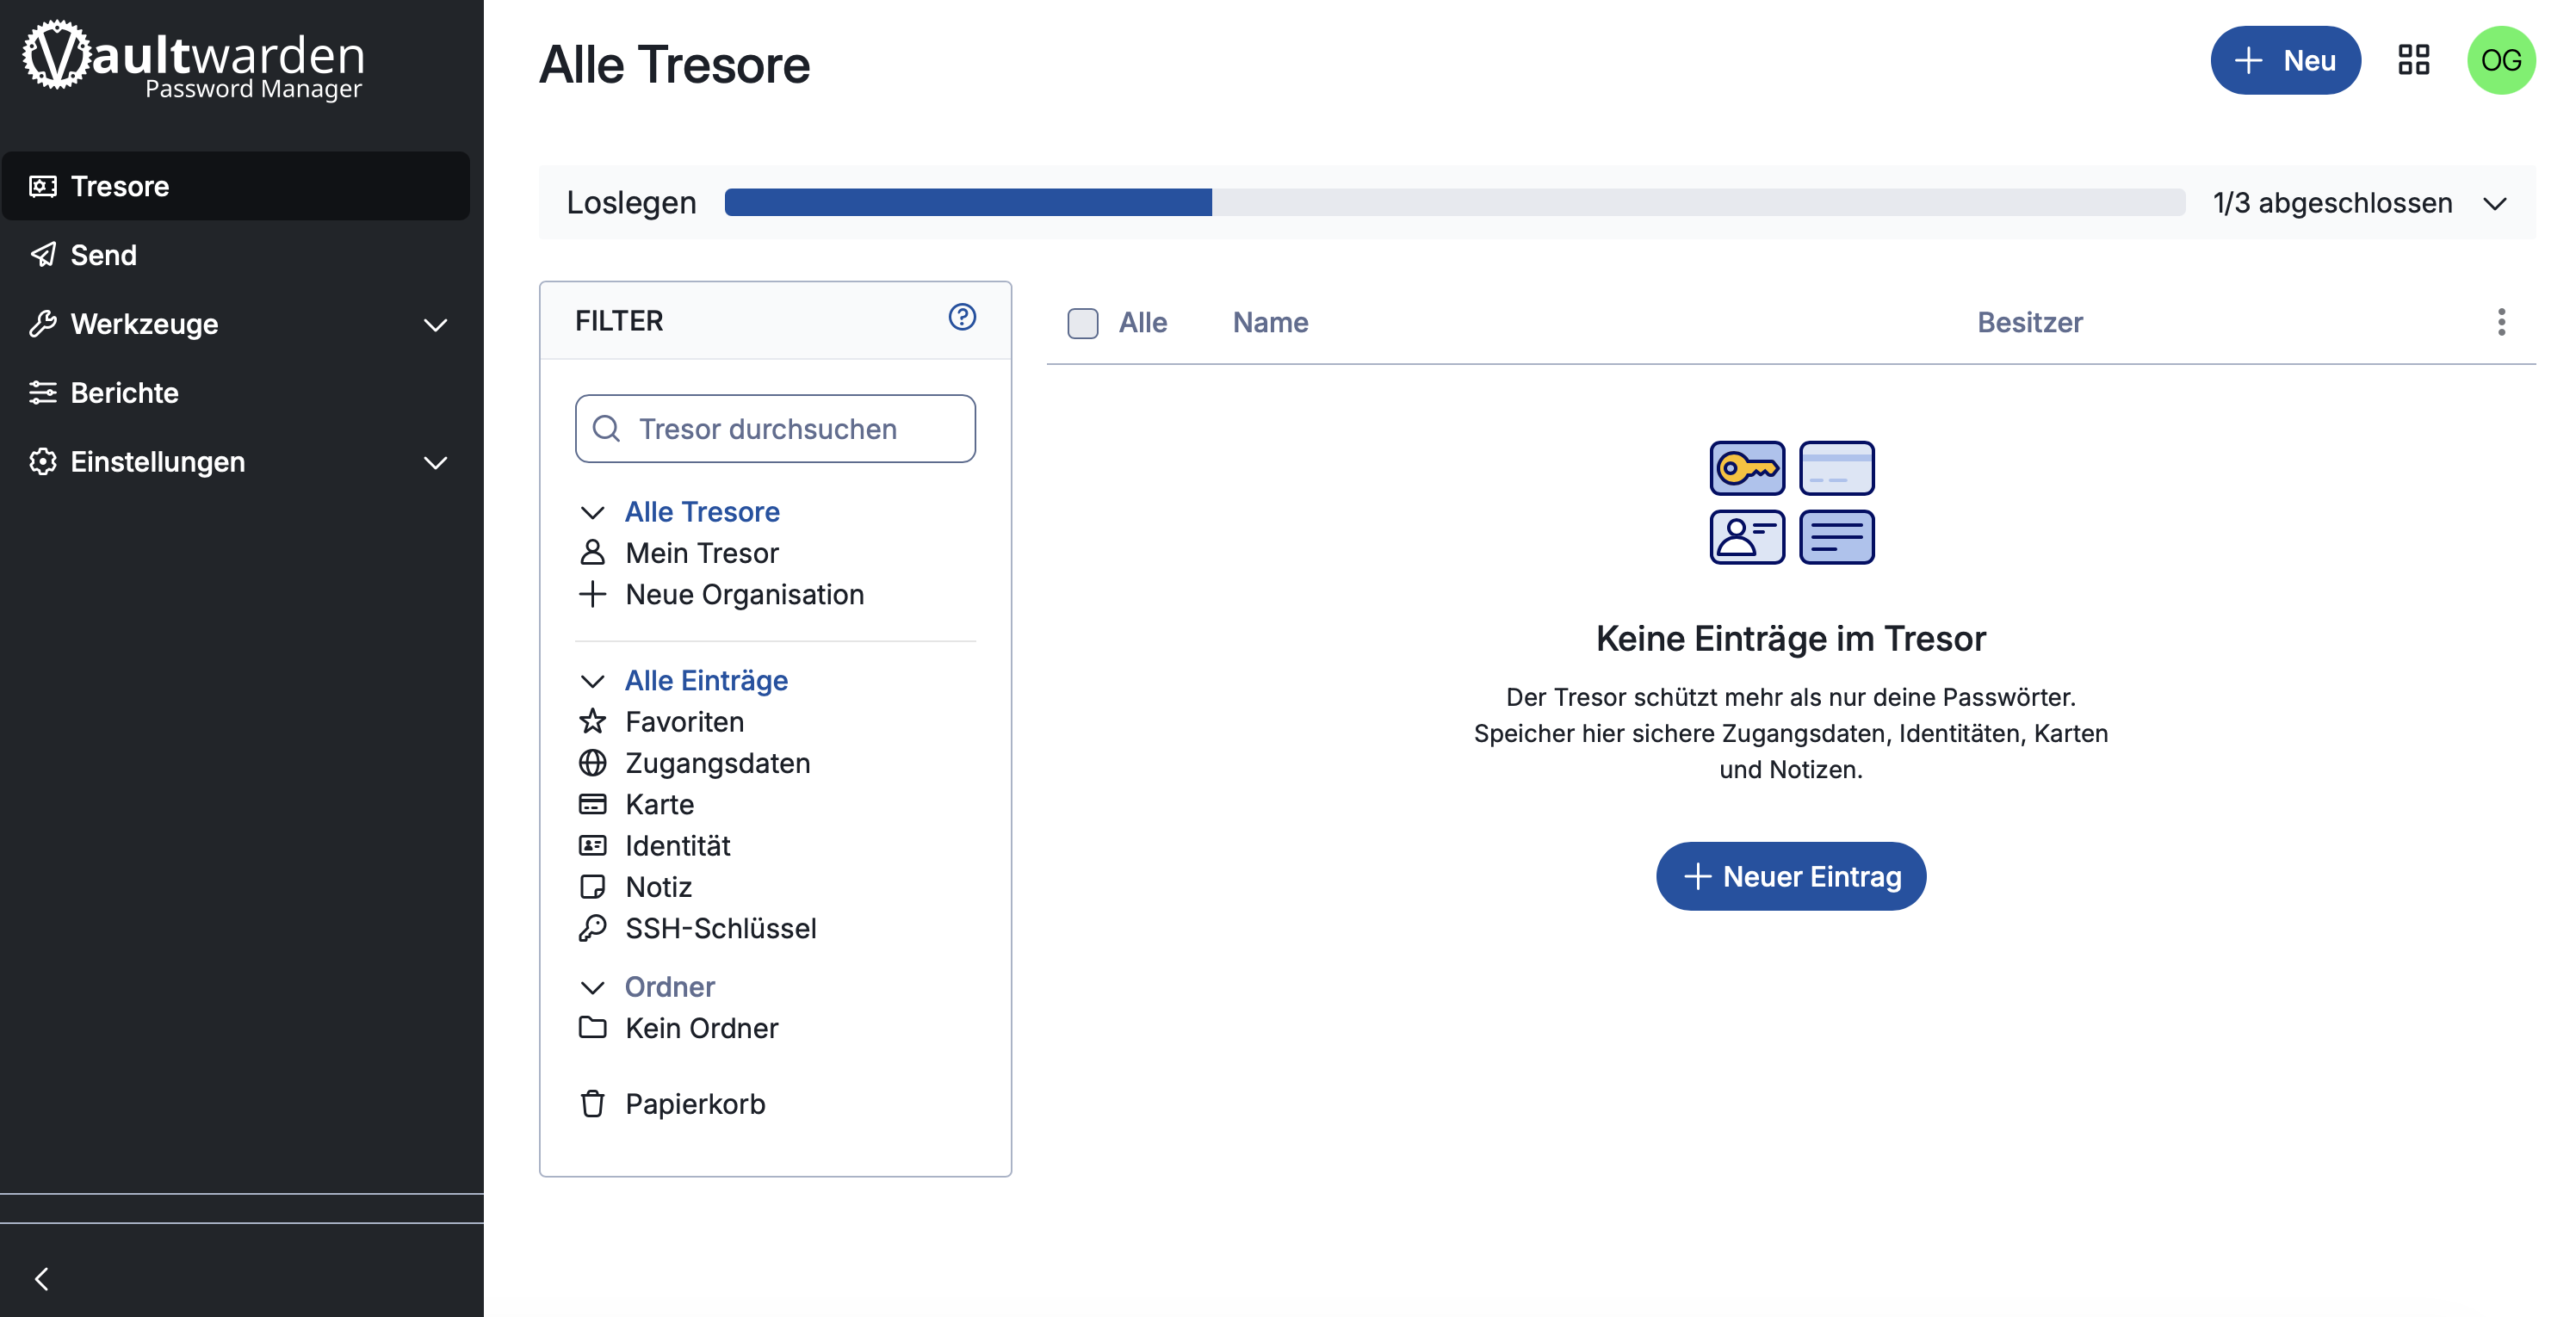
Vaultwarden
Vaultwarden is a lightweight self-hosted password manager compatible with Bitwarden clients.
It was added to the lab as a security-related service.
Its purpose is to securely store credentials for the homelab and other test systems.
Important concepts learned:
- Password manager hosting
- HTTPS requirement
- Reverse proxy integration
- Local certificates
- Account registration control
- Persistent Docker volumes
Vaultwarden was configured behind Nginx Proxy Manager and accessed through HTTPS.
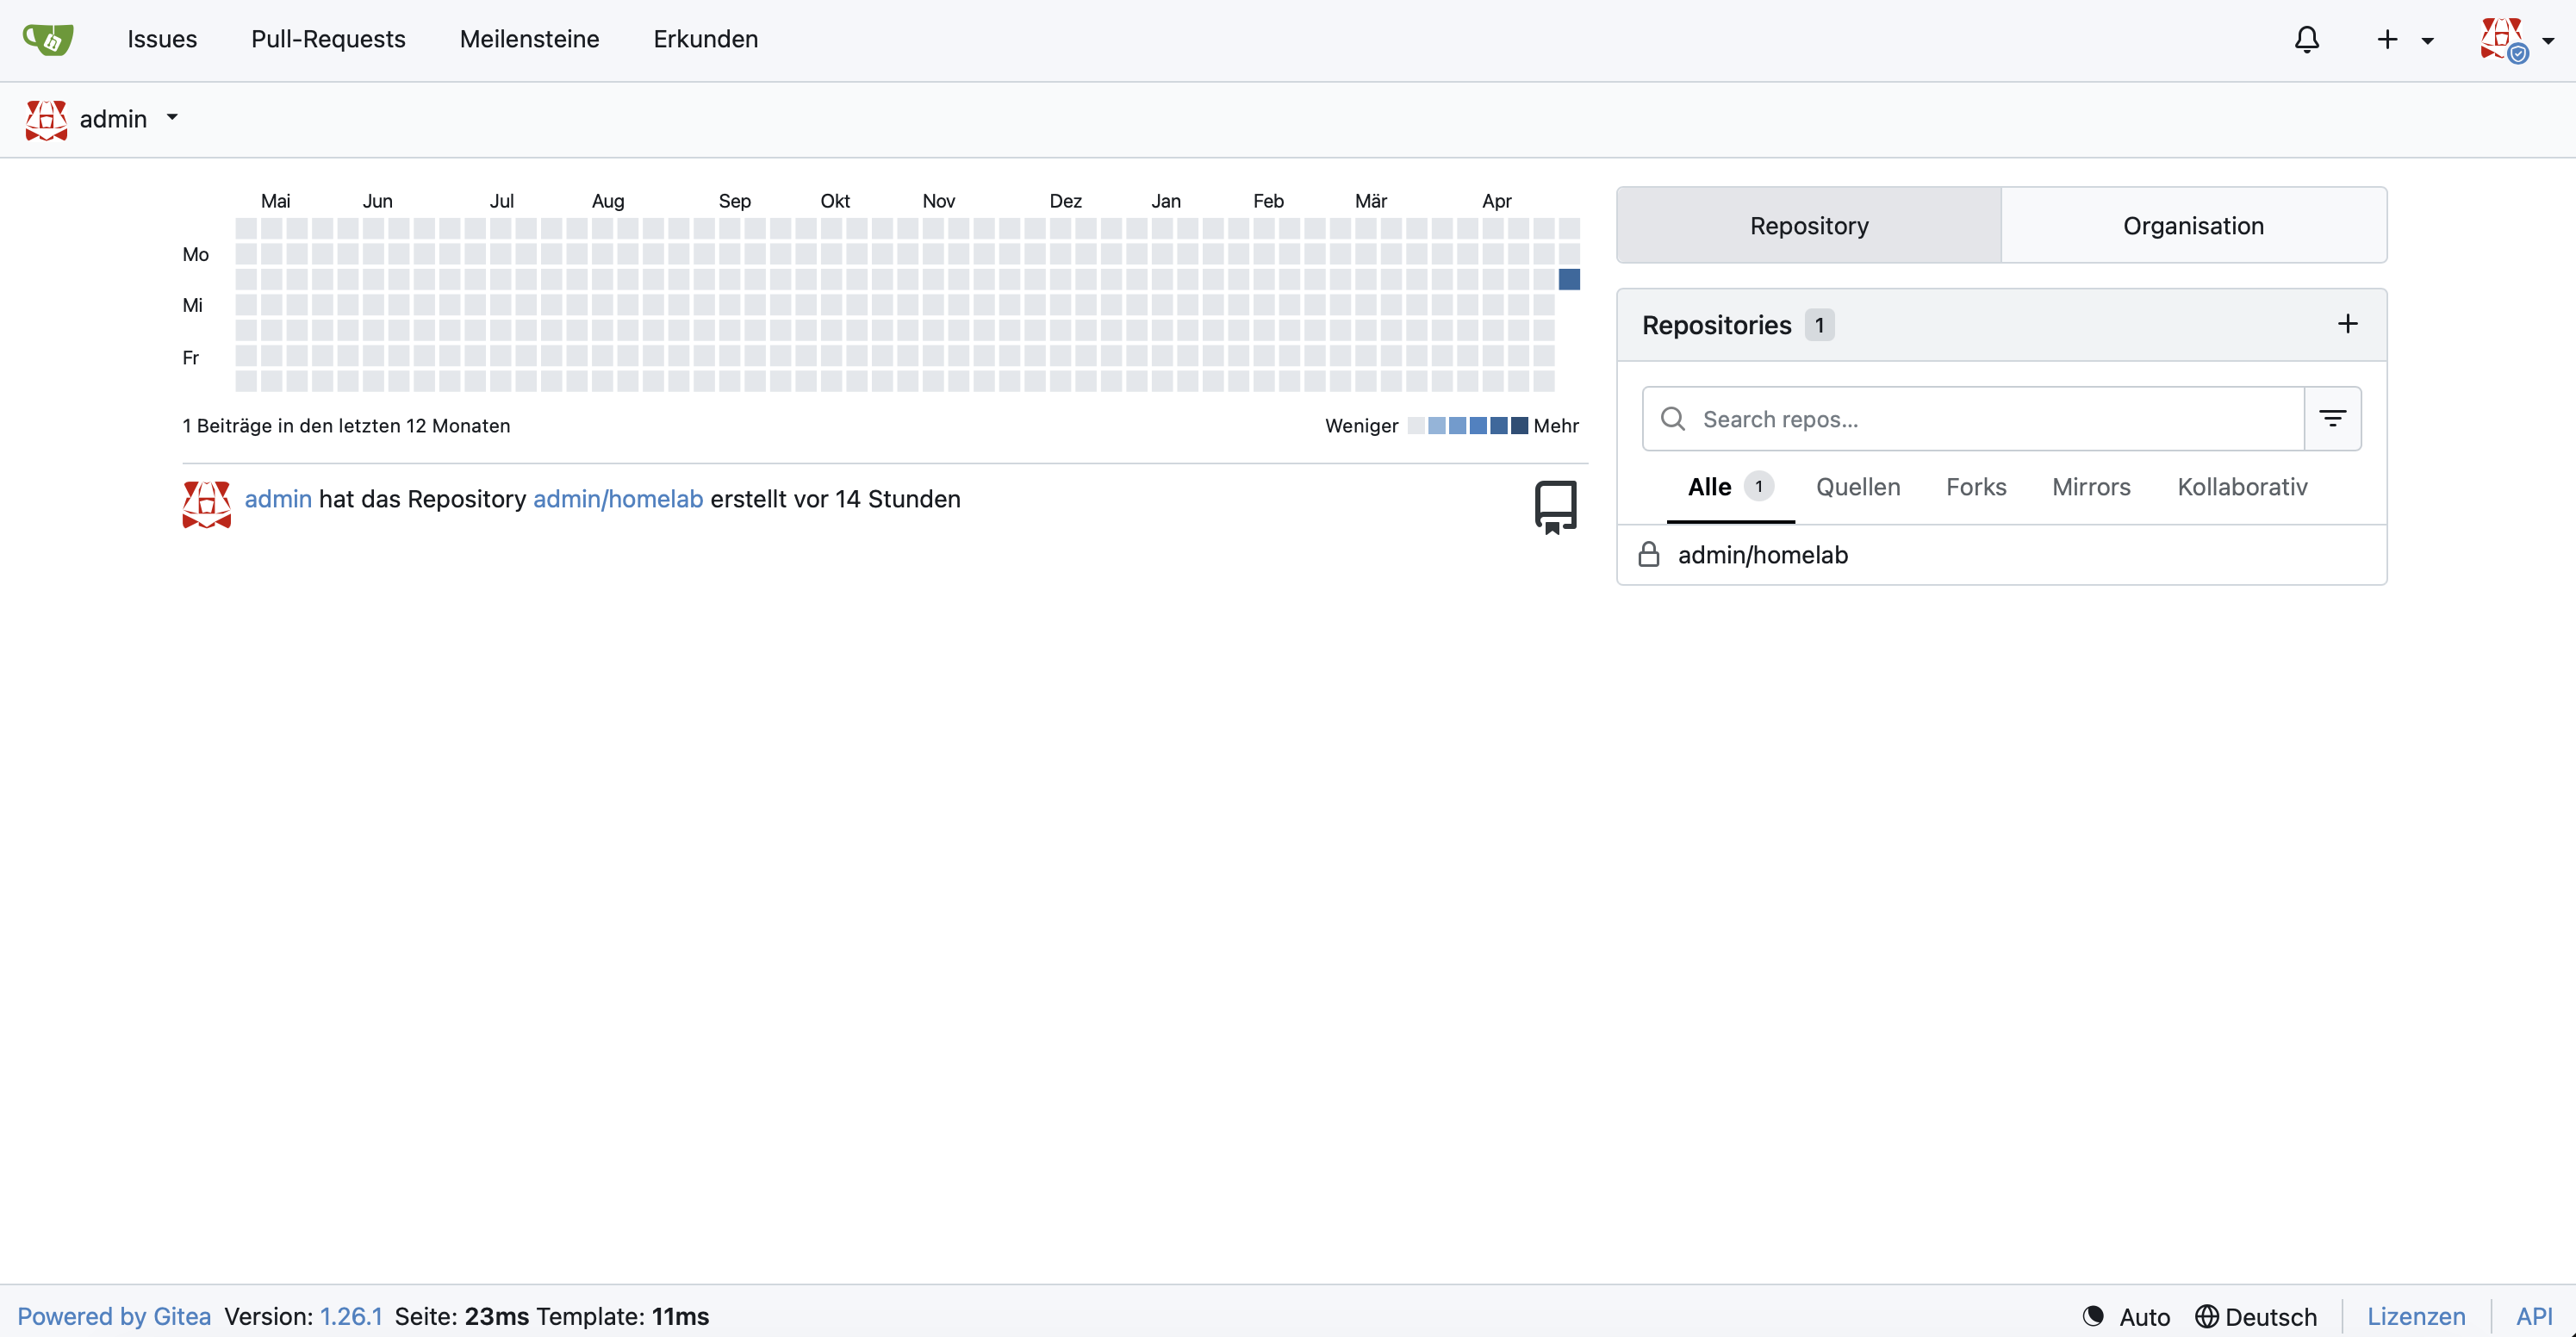
Gitea
Gitea is a self-hosted Git platform.
It provides functionality similar to GitHub or GitLab, but runs locally inside the lab.
It can be used to store:
- Docker Compose files
- Infrastructure notes
- README files
- Scripts
- Lab documentation
- Future project repositories
Gitea is useful because infrastructure should be version-controlled. This supports GitOps and DevOps workflows.
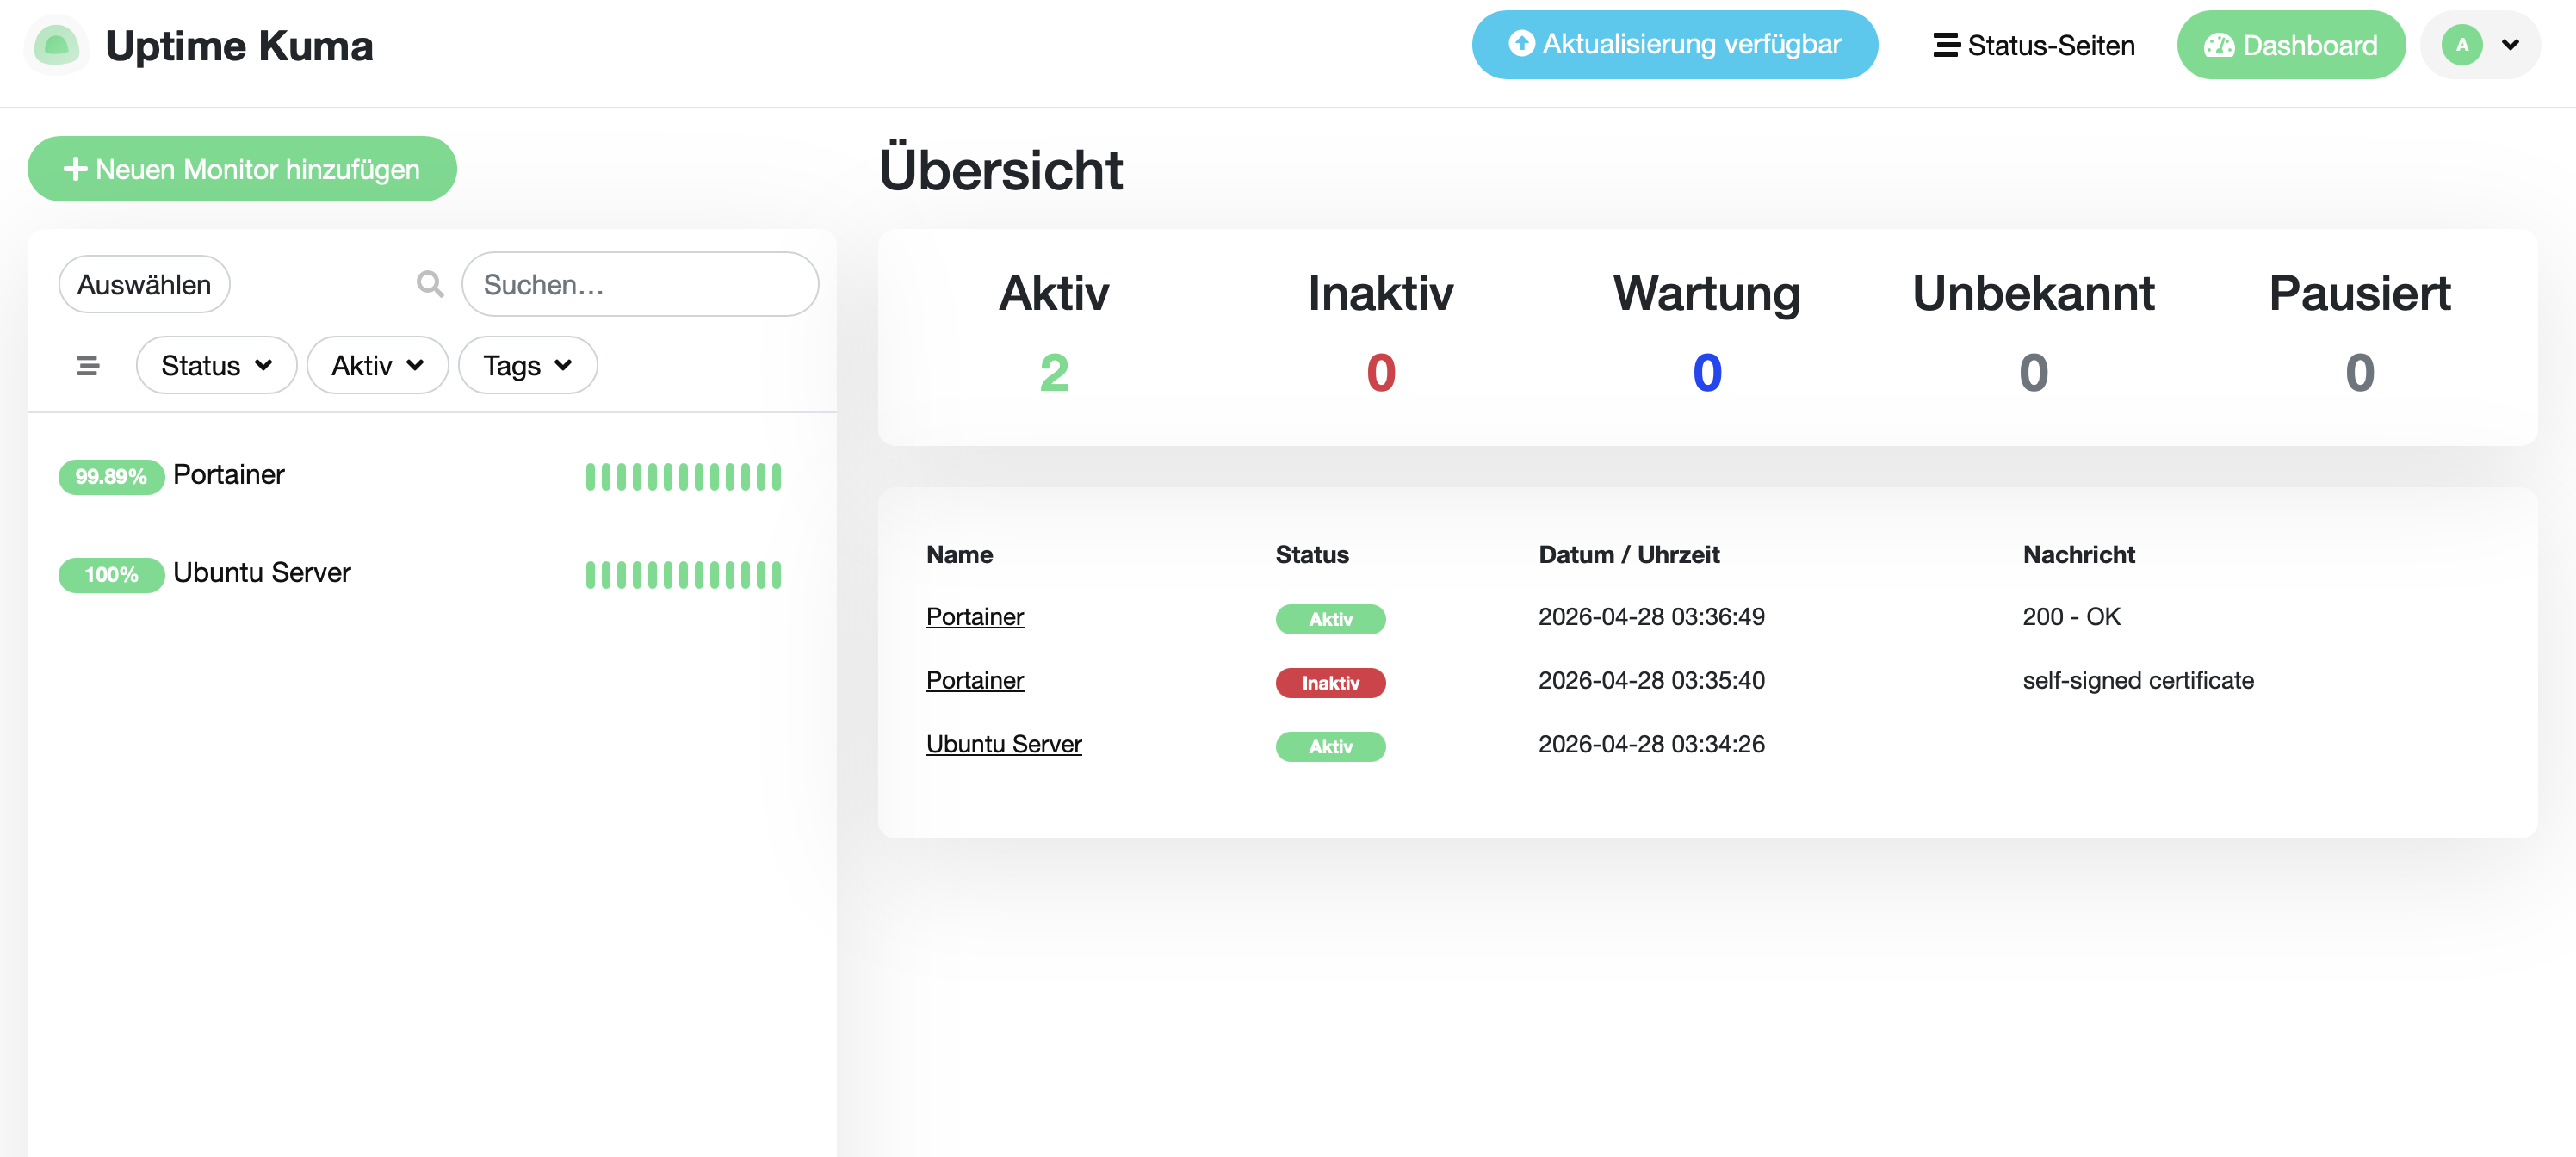
Uptime Kuma
Uptime Kuma was installed for availability monitoring.
It checks if services are online and reachable.
Examples of monitored targets:
Ubuntu Server
Portainer
Vaultwarden
Gitea
Nginx Proxy Manager
Grafana
Uptime Kuma is useful because it gives a simple and clear view of service availability.
It answers the question:
Is the service reachable right now?
This is different from Grafana and Prometheus, which focus more on metrics and deeper monitoring.
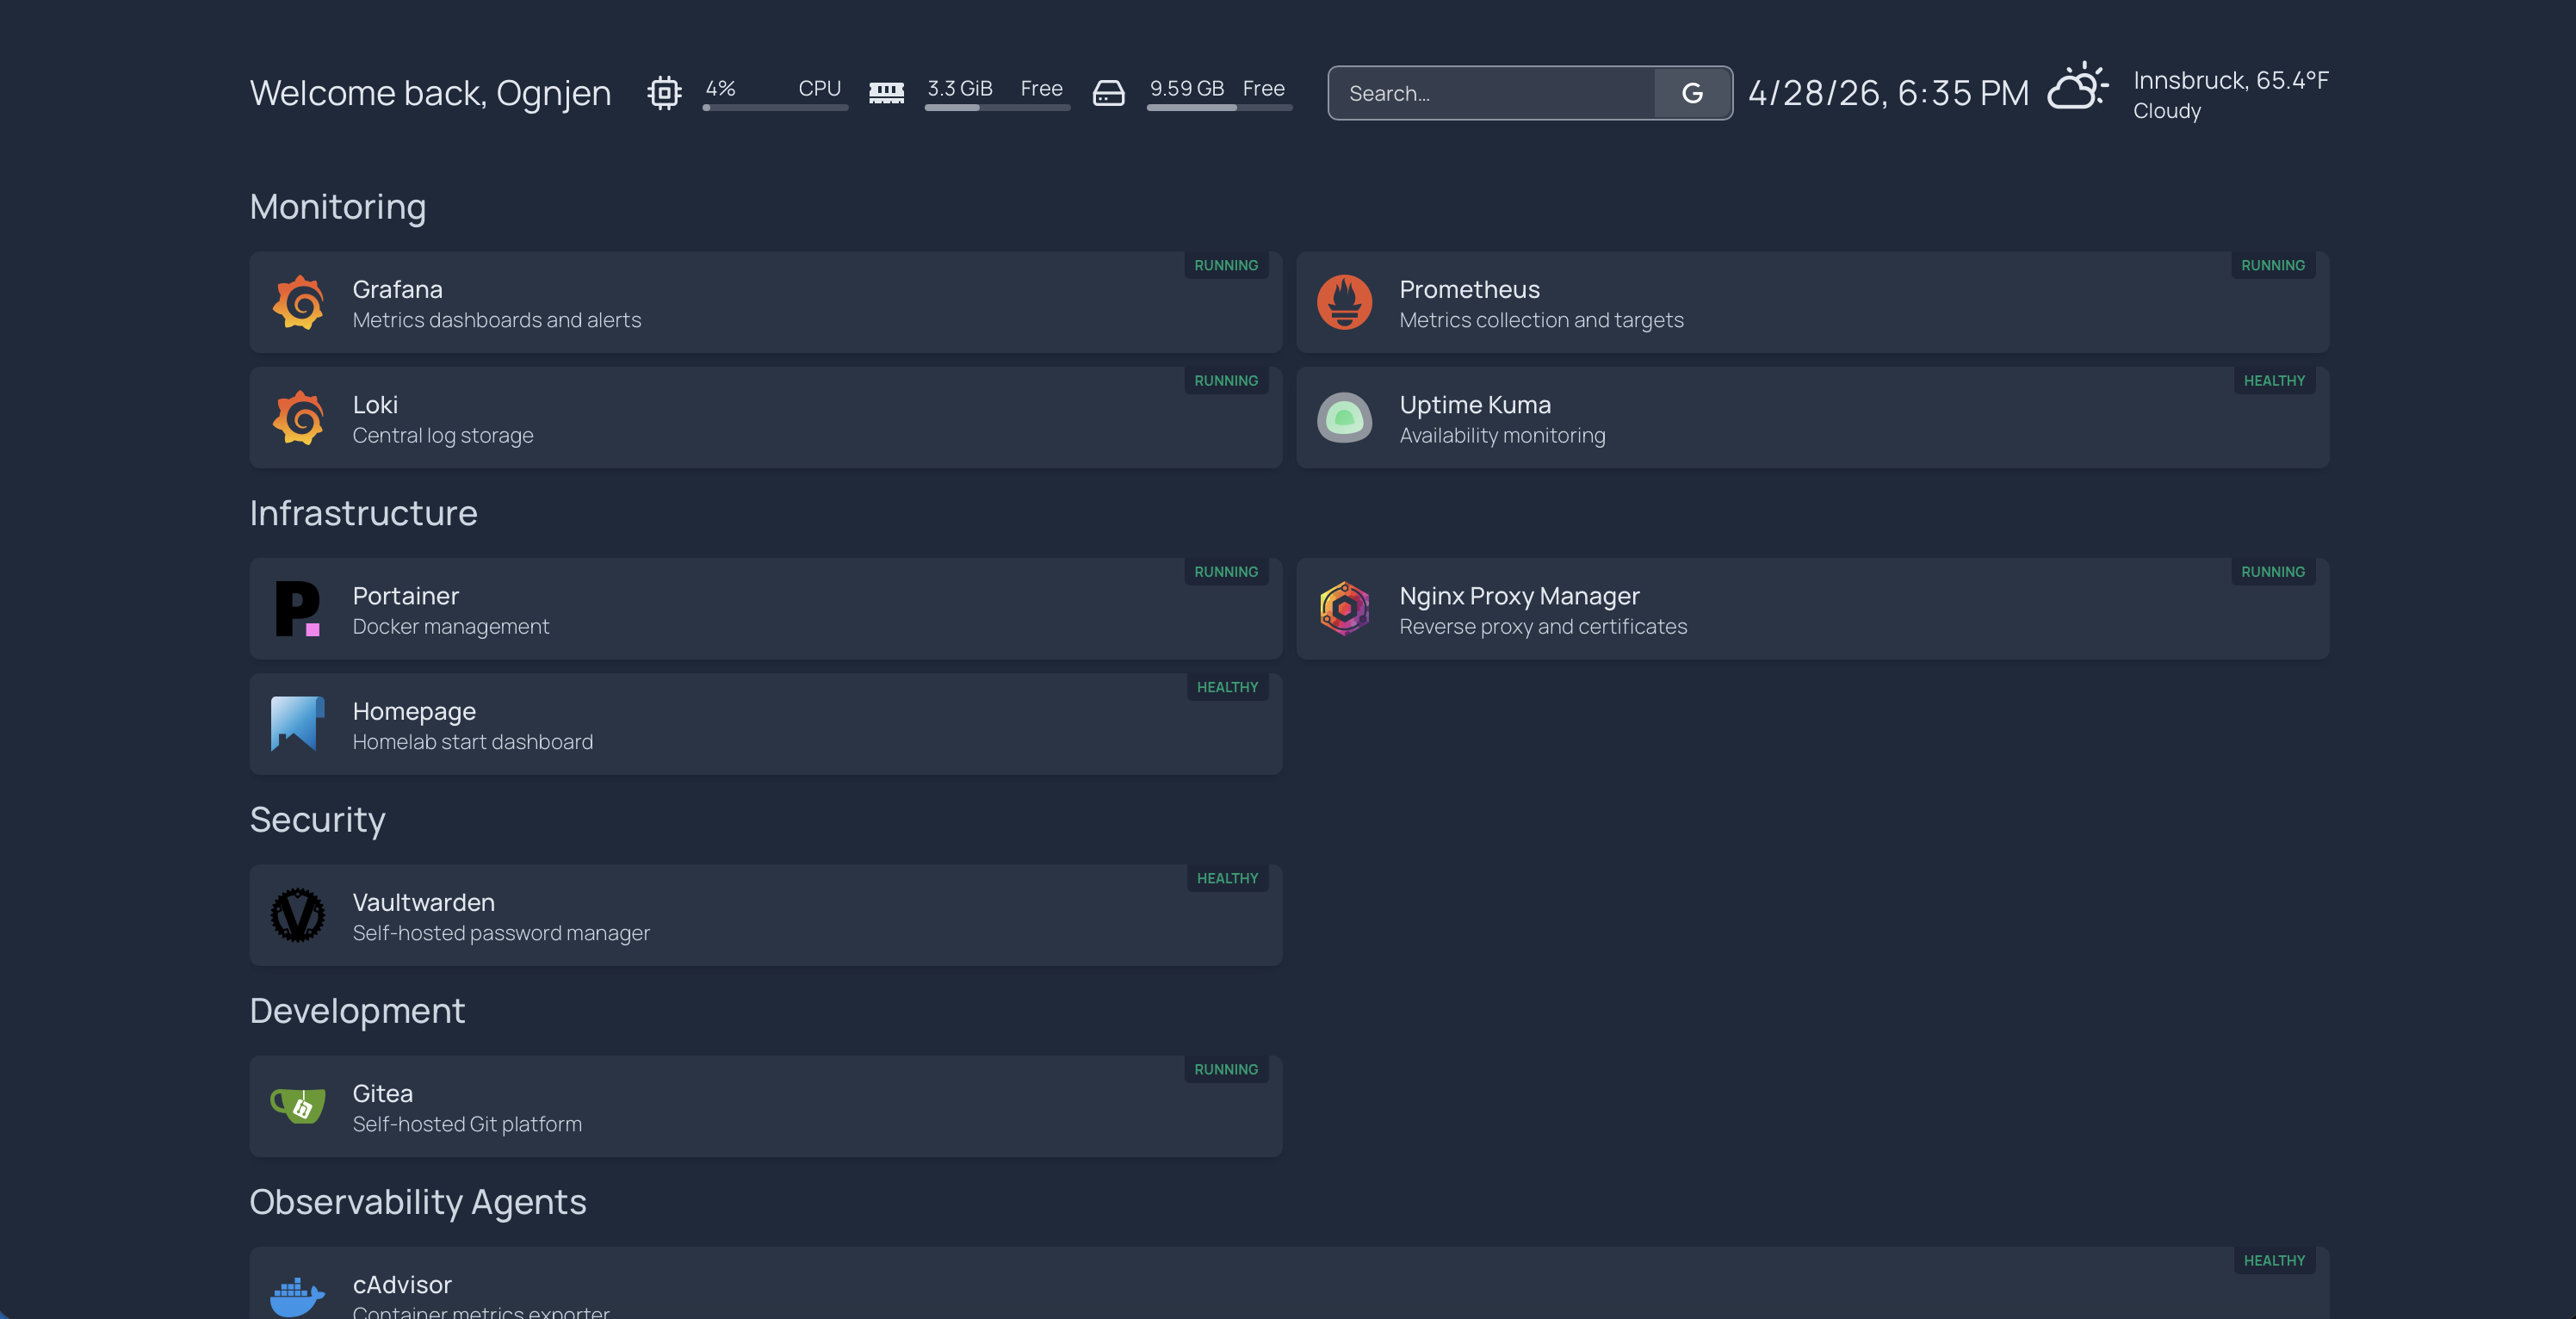
Homepage Dashboard
Homepage was configured as the central dashboard for the entire lab.
Its purpose is to act as a single entry point for all internal services.
Instead of remembering many URLs and ports, all tools are available from one page.
The dashboard includes categories such as:
- Monitoring
- Infrastructure
- Security
- Development
- Observability Agents
It also displays live system widgets such as:
- CPU usage
- Memory usage
- Disk space
- Date and time
- Weather
- Search bar
- Docker container status
This makes the lab feel like a real internal operations portal.
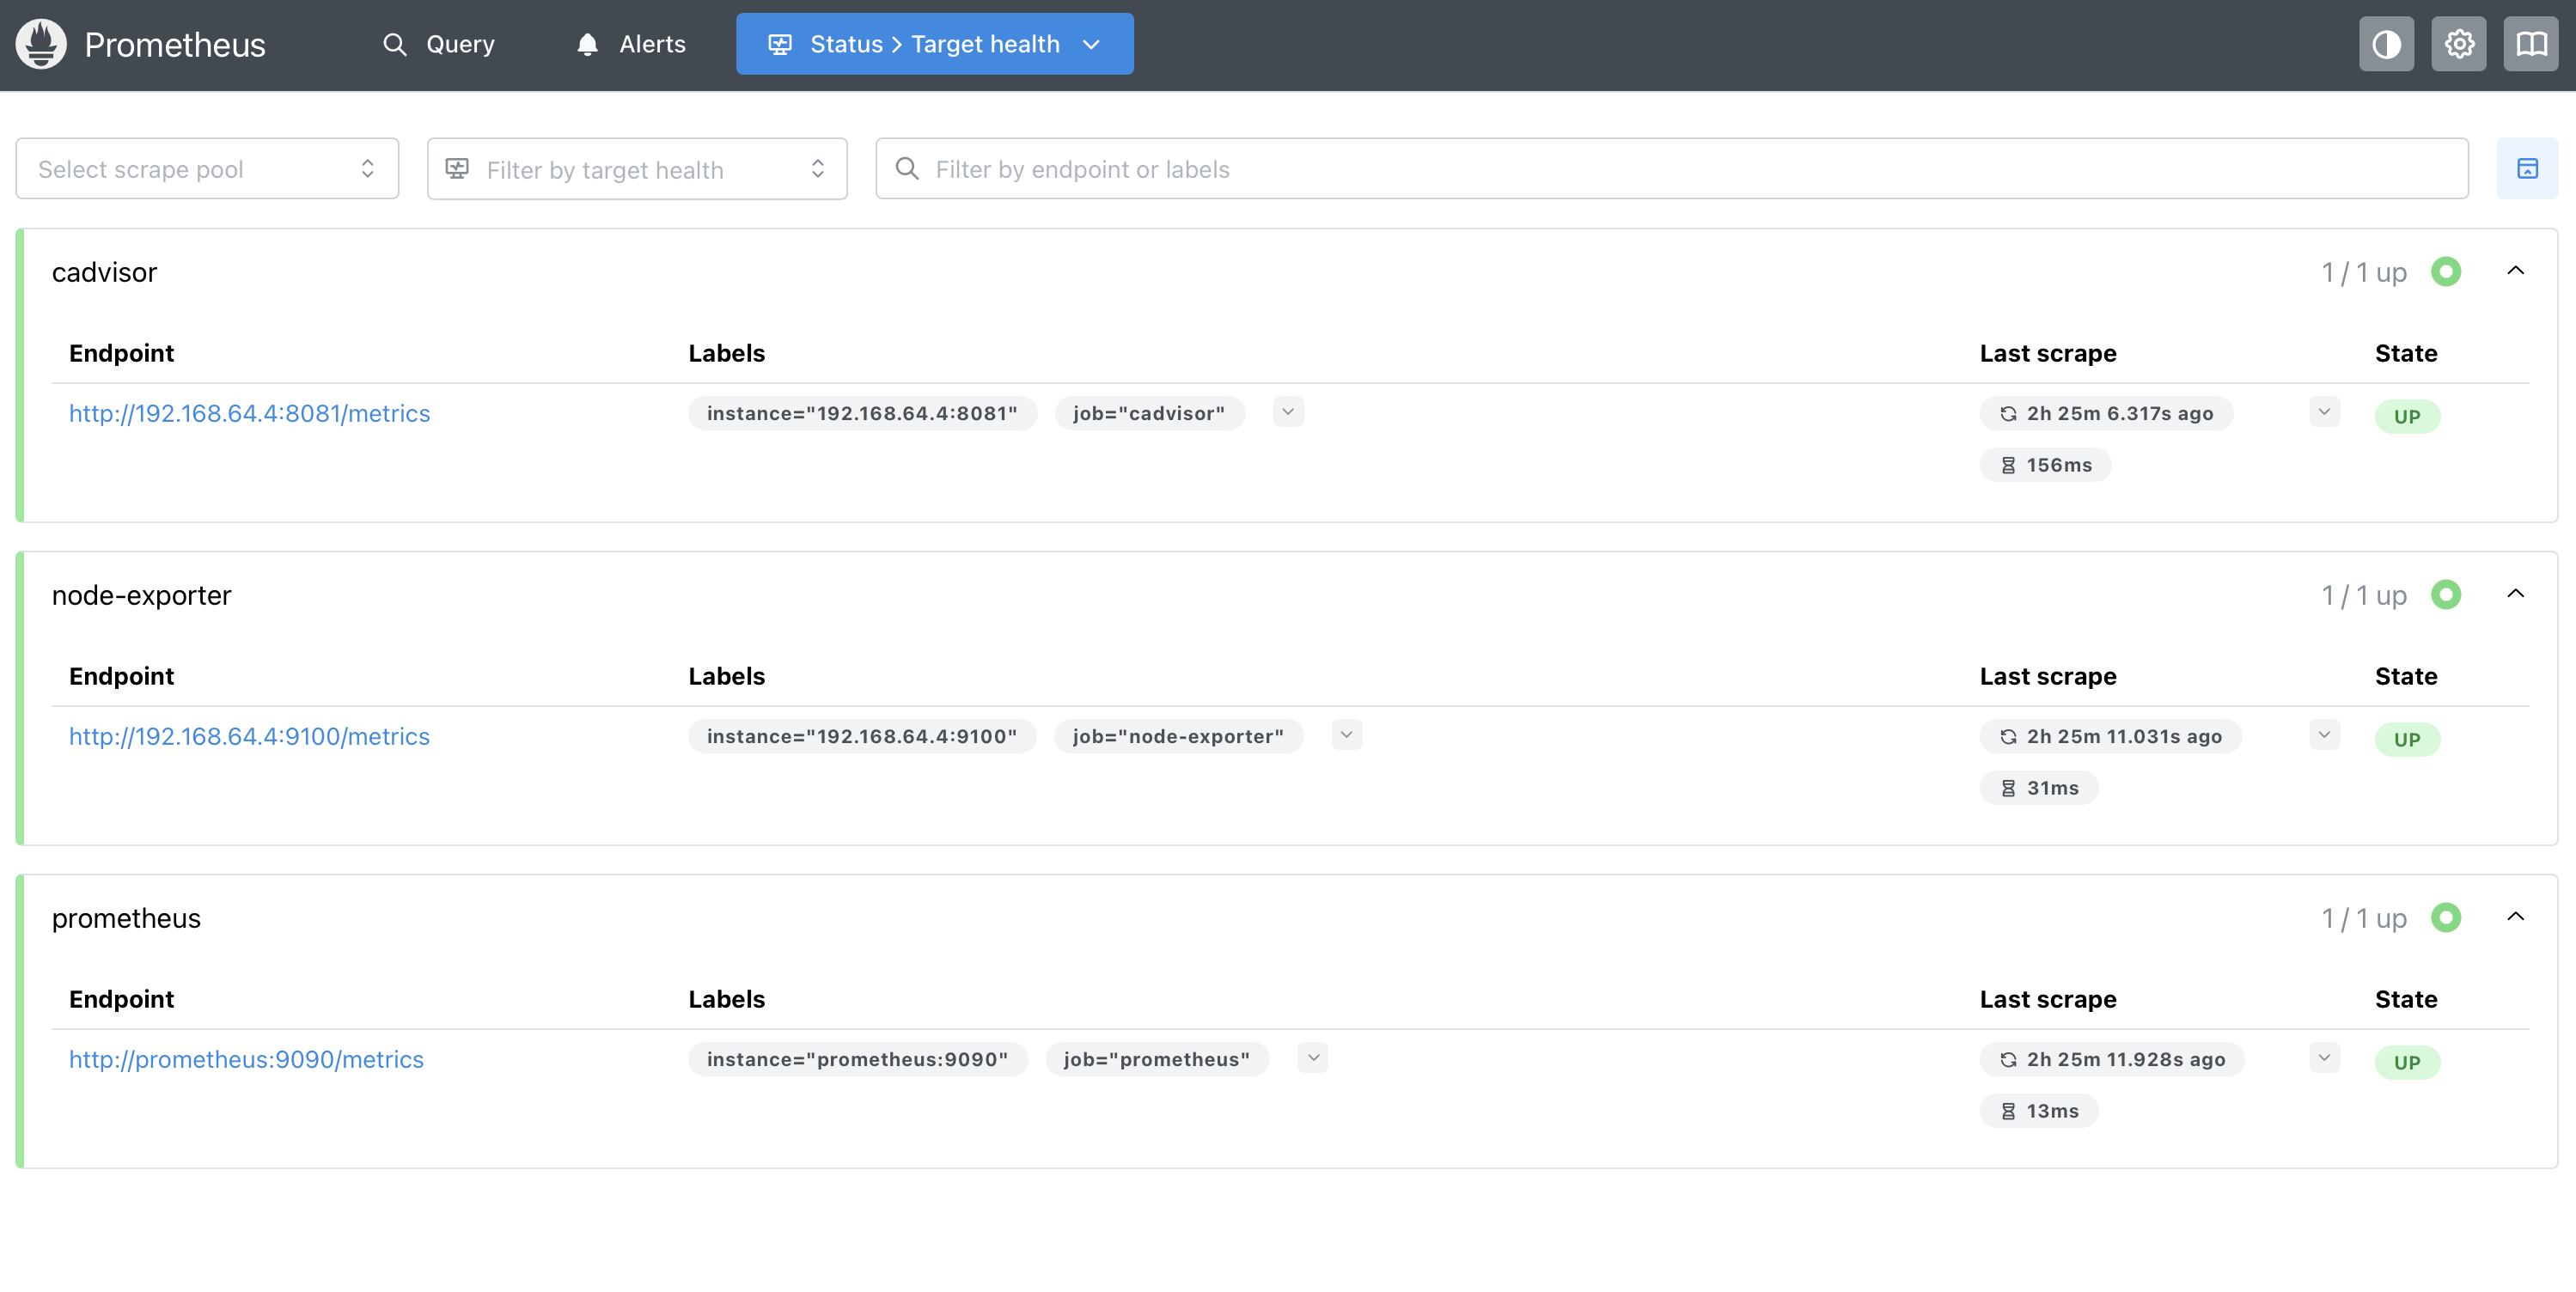
Prometheus
Prometheus is the metrics collection system.
It regularly scrapes endpoints that expose metrics.
In this project, Prometheus scrapes:
- Prometheus itself
- Node Exporter
- cAdvisor
Prometheus stores time-series data such as:
- CPU usage
- Memory usage
- Disk usage
- Container CPU usage
- Container memory usage
- Network traffic
Prometheus is the backend data source for Grafana dashboards and alert rules.
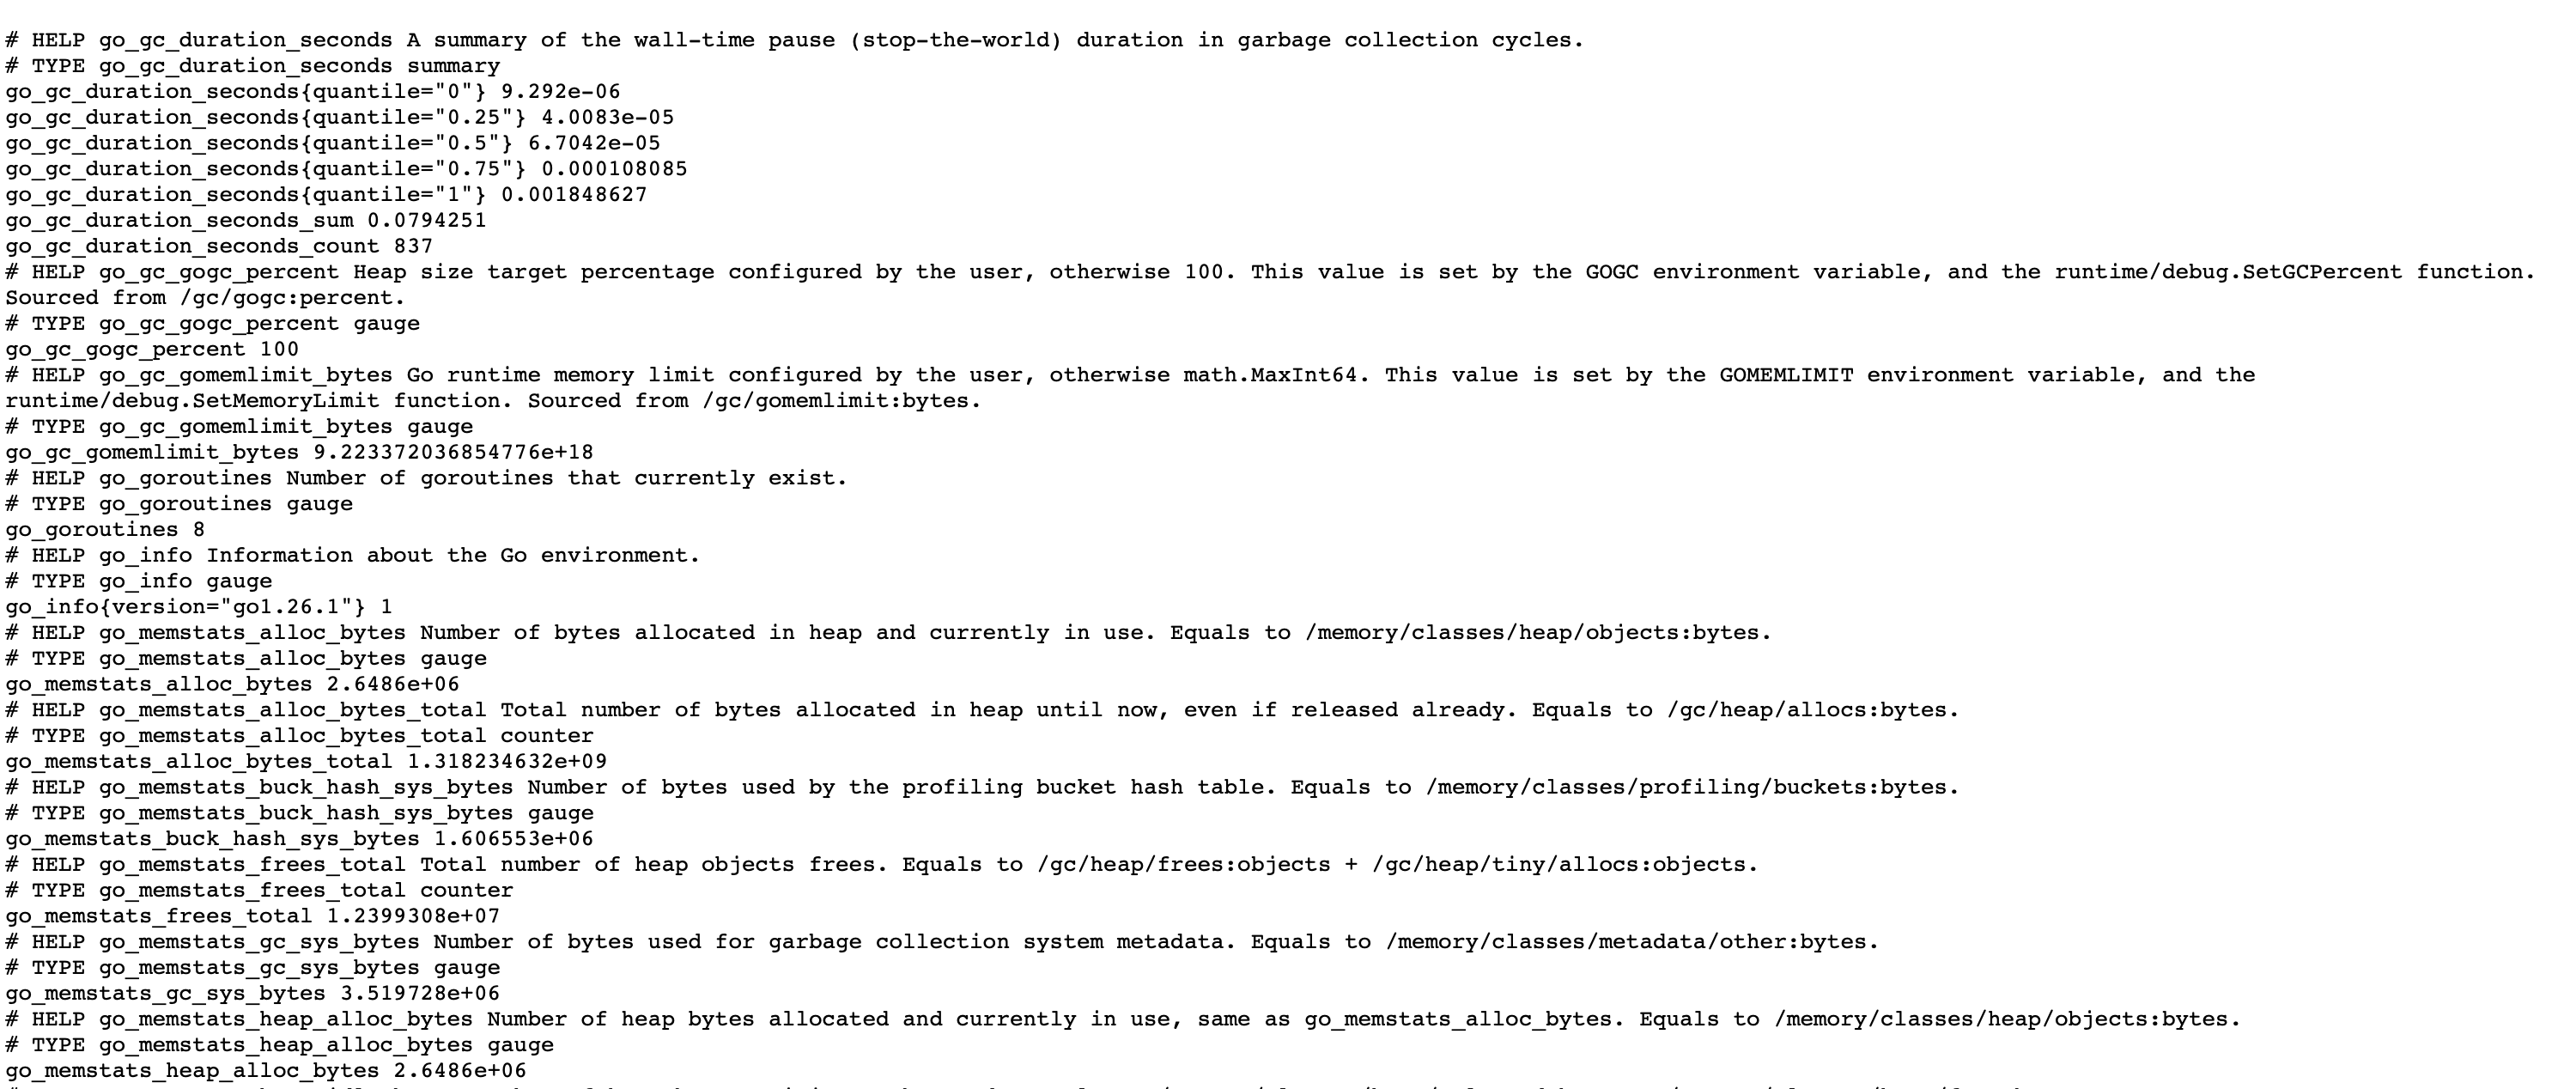
Node Exporter
Node Exporter exposes Linux host metrics.
It allows Prometheus to collect system-level information from the Ubuntu Server VM.
Metrics include:
- CPU usage
- RAM usage
- Disk usage
- Filesystem information
- Network activity
- Load average
- Uptime
Node Exporter was verified by opening:
http://192.168.64.4:9100/metrics
When the metrics text appeared, the exporter was working correctly.
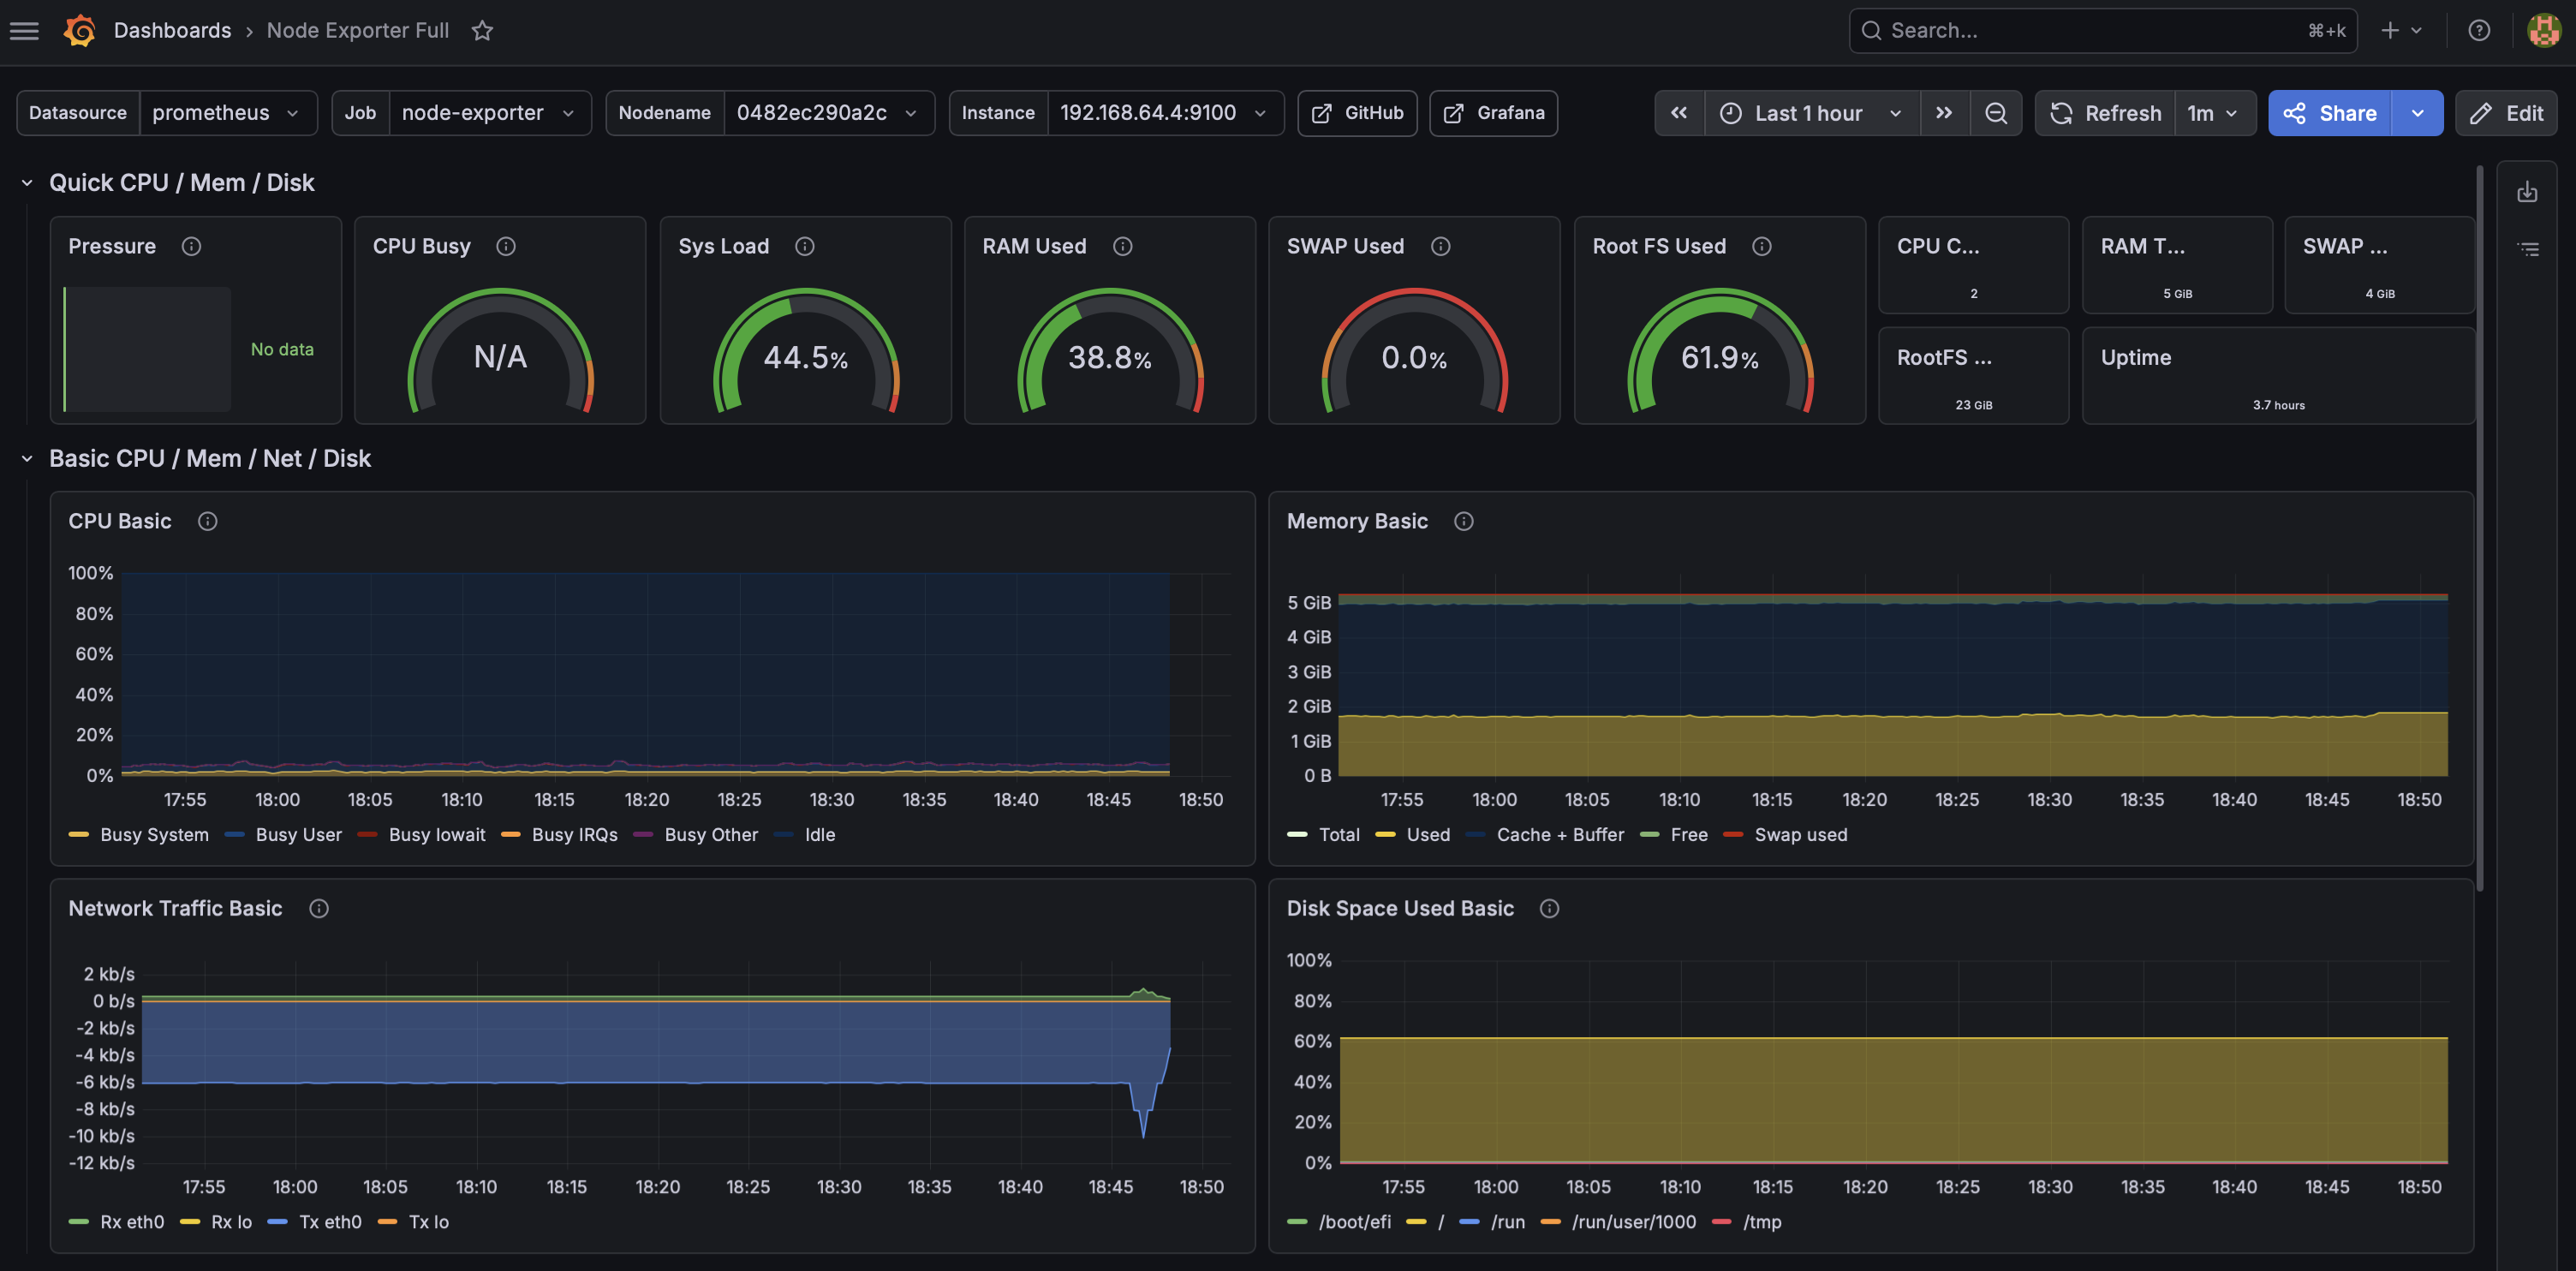
Grafana
Grafana is the visualization and alerting platform.
It connects to Prometheus and Loki as data sources.
Prometheus provides metrics, and Loki provides logs.
Grafana was used to:
- Import monitoring dashboards
- Visualize host metrics
- Visualize container metrics
- Create alert rules
- Send alerts to Discord
- Explore logs from Loki
A Node Exporter dashboard was imported to show host-level metrics.
The dashboard displays:
- CPU
- RAM
- Disk usage
- Network traffic
- Load average
- Uptime
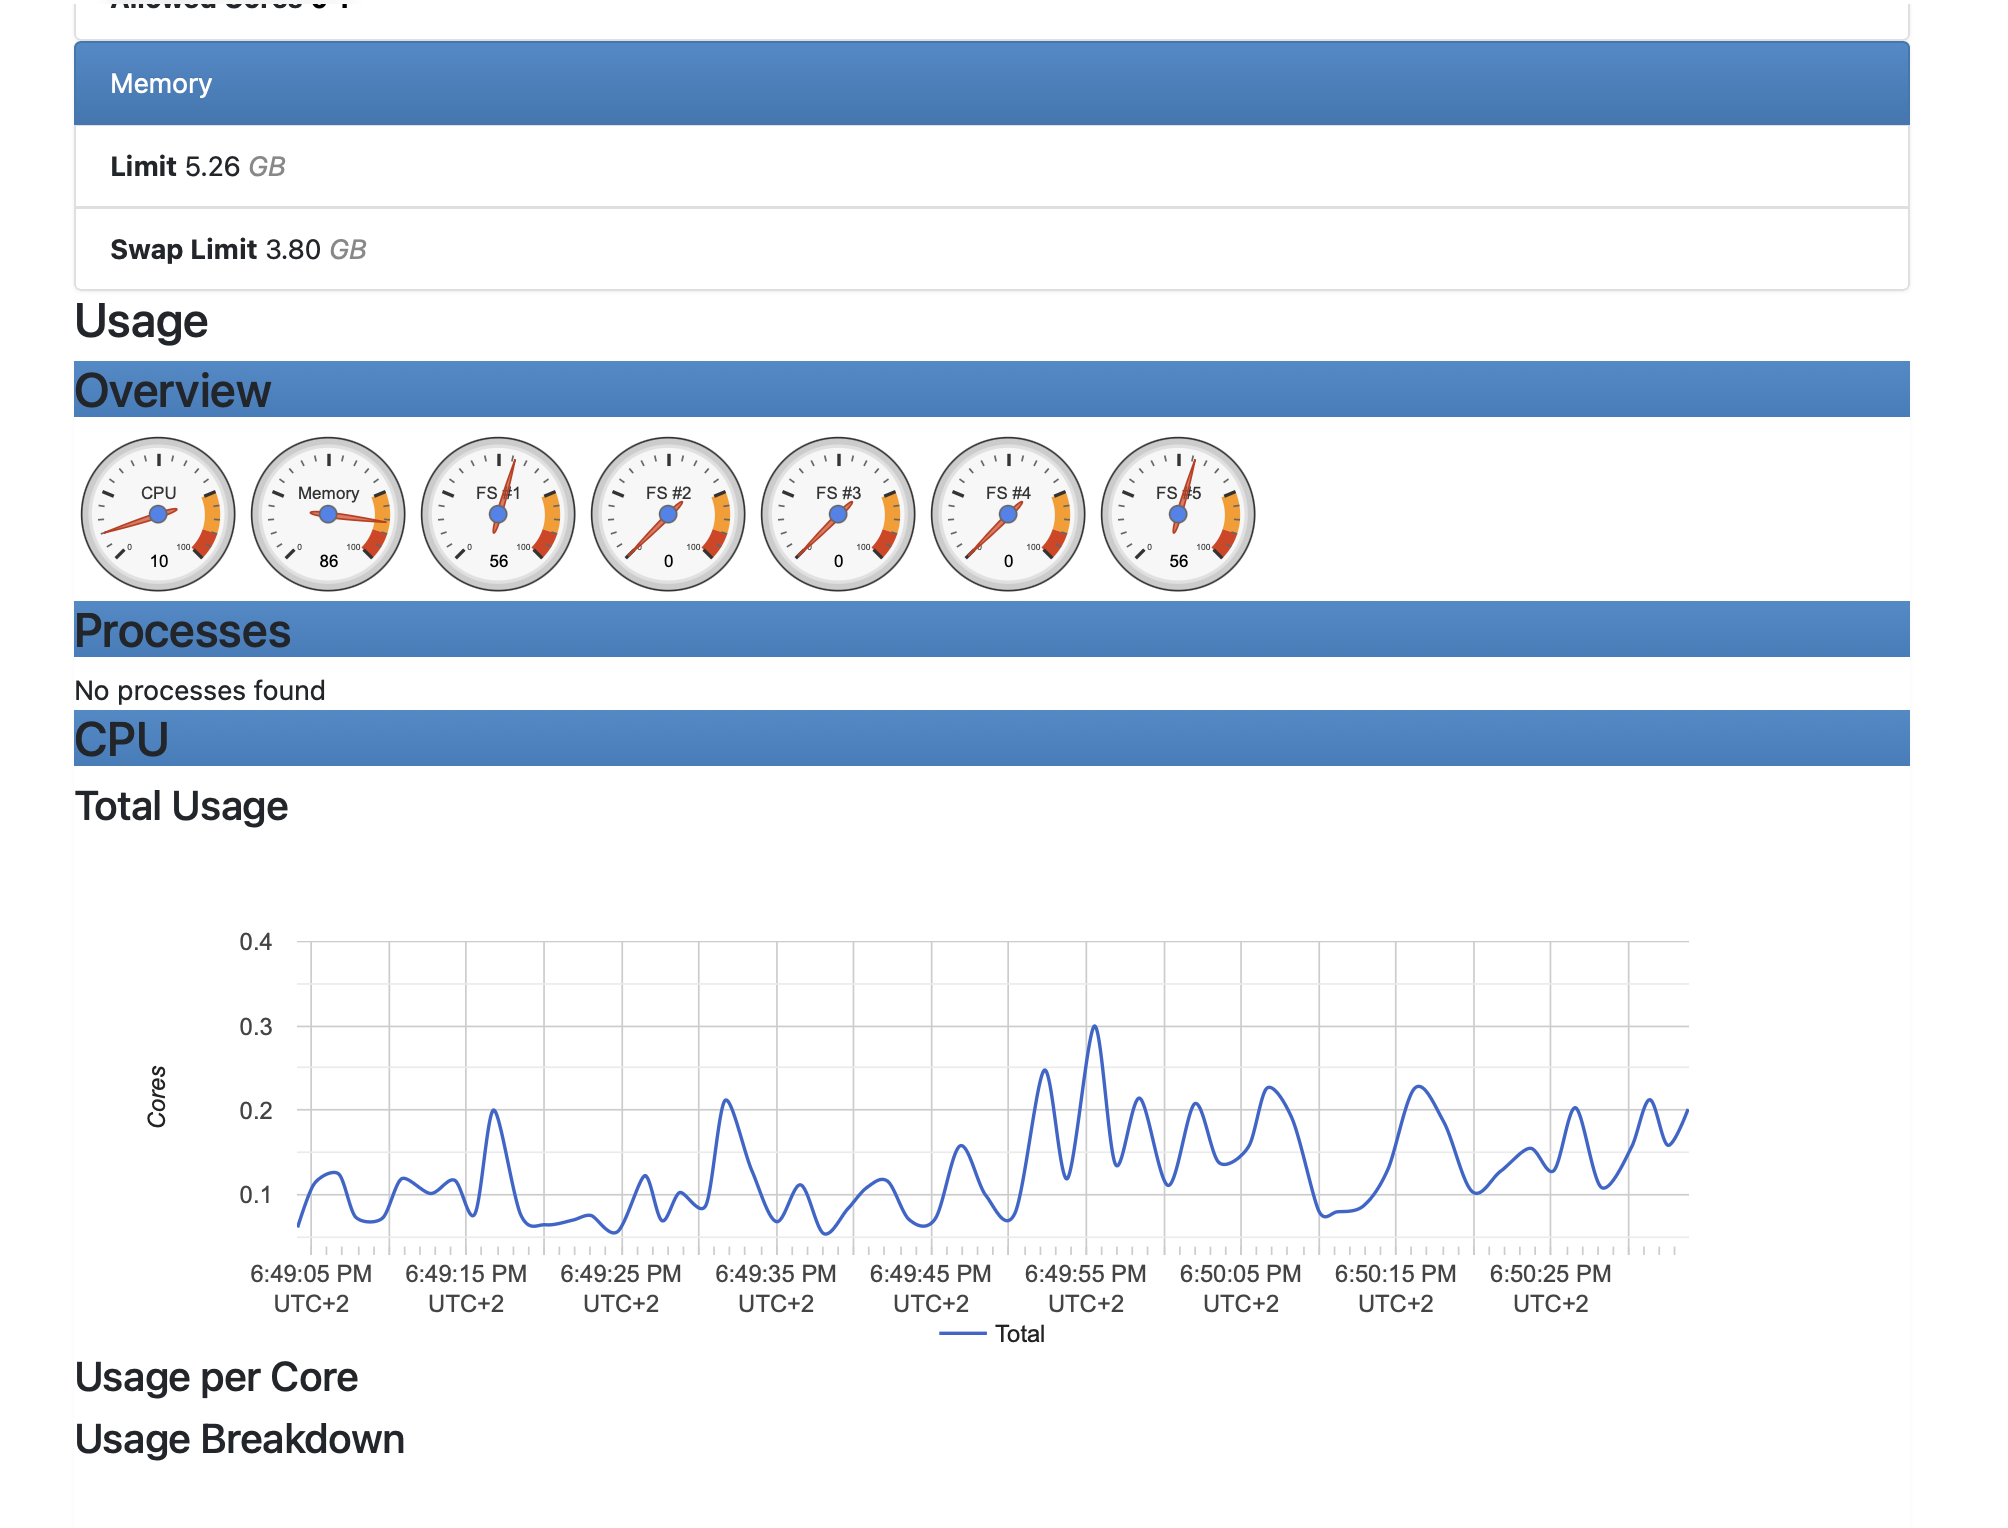
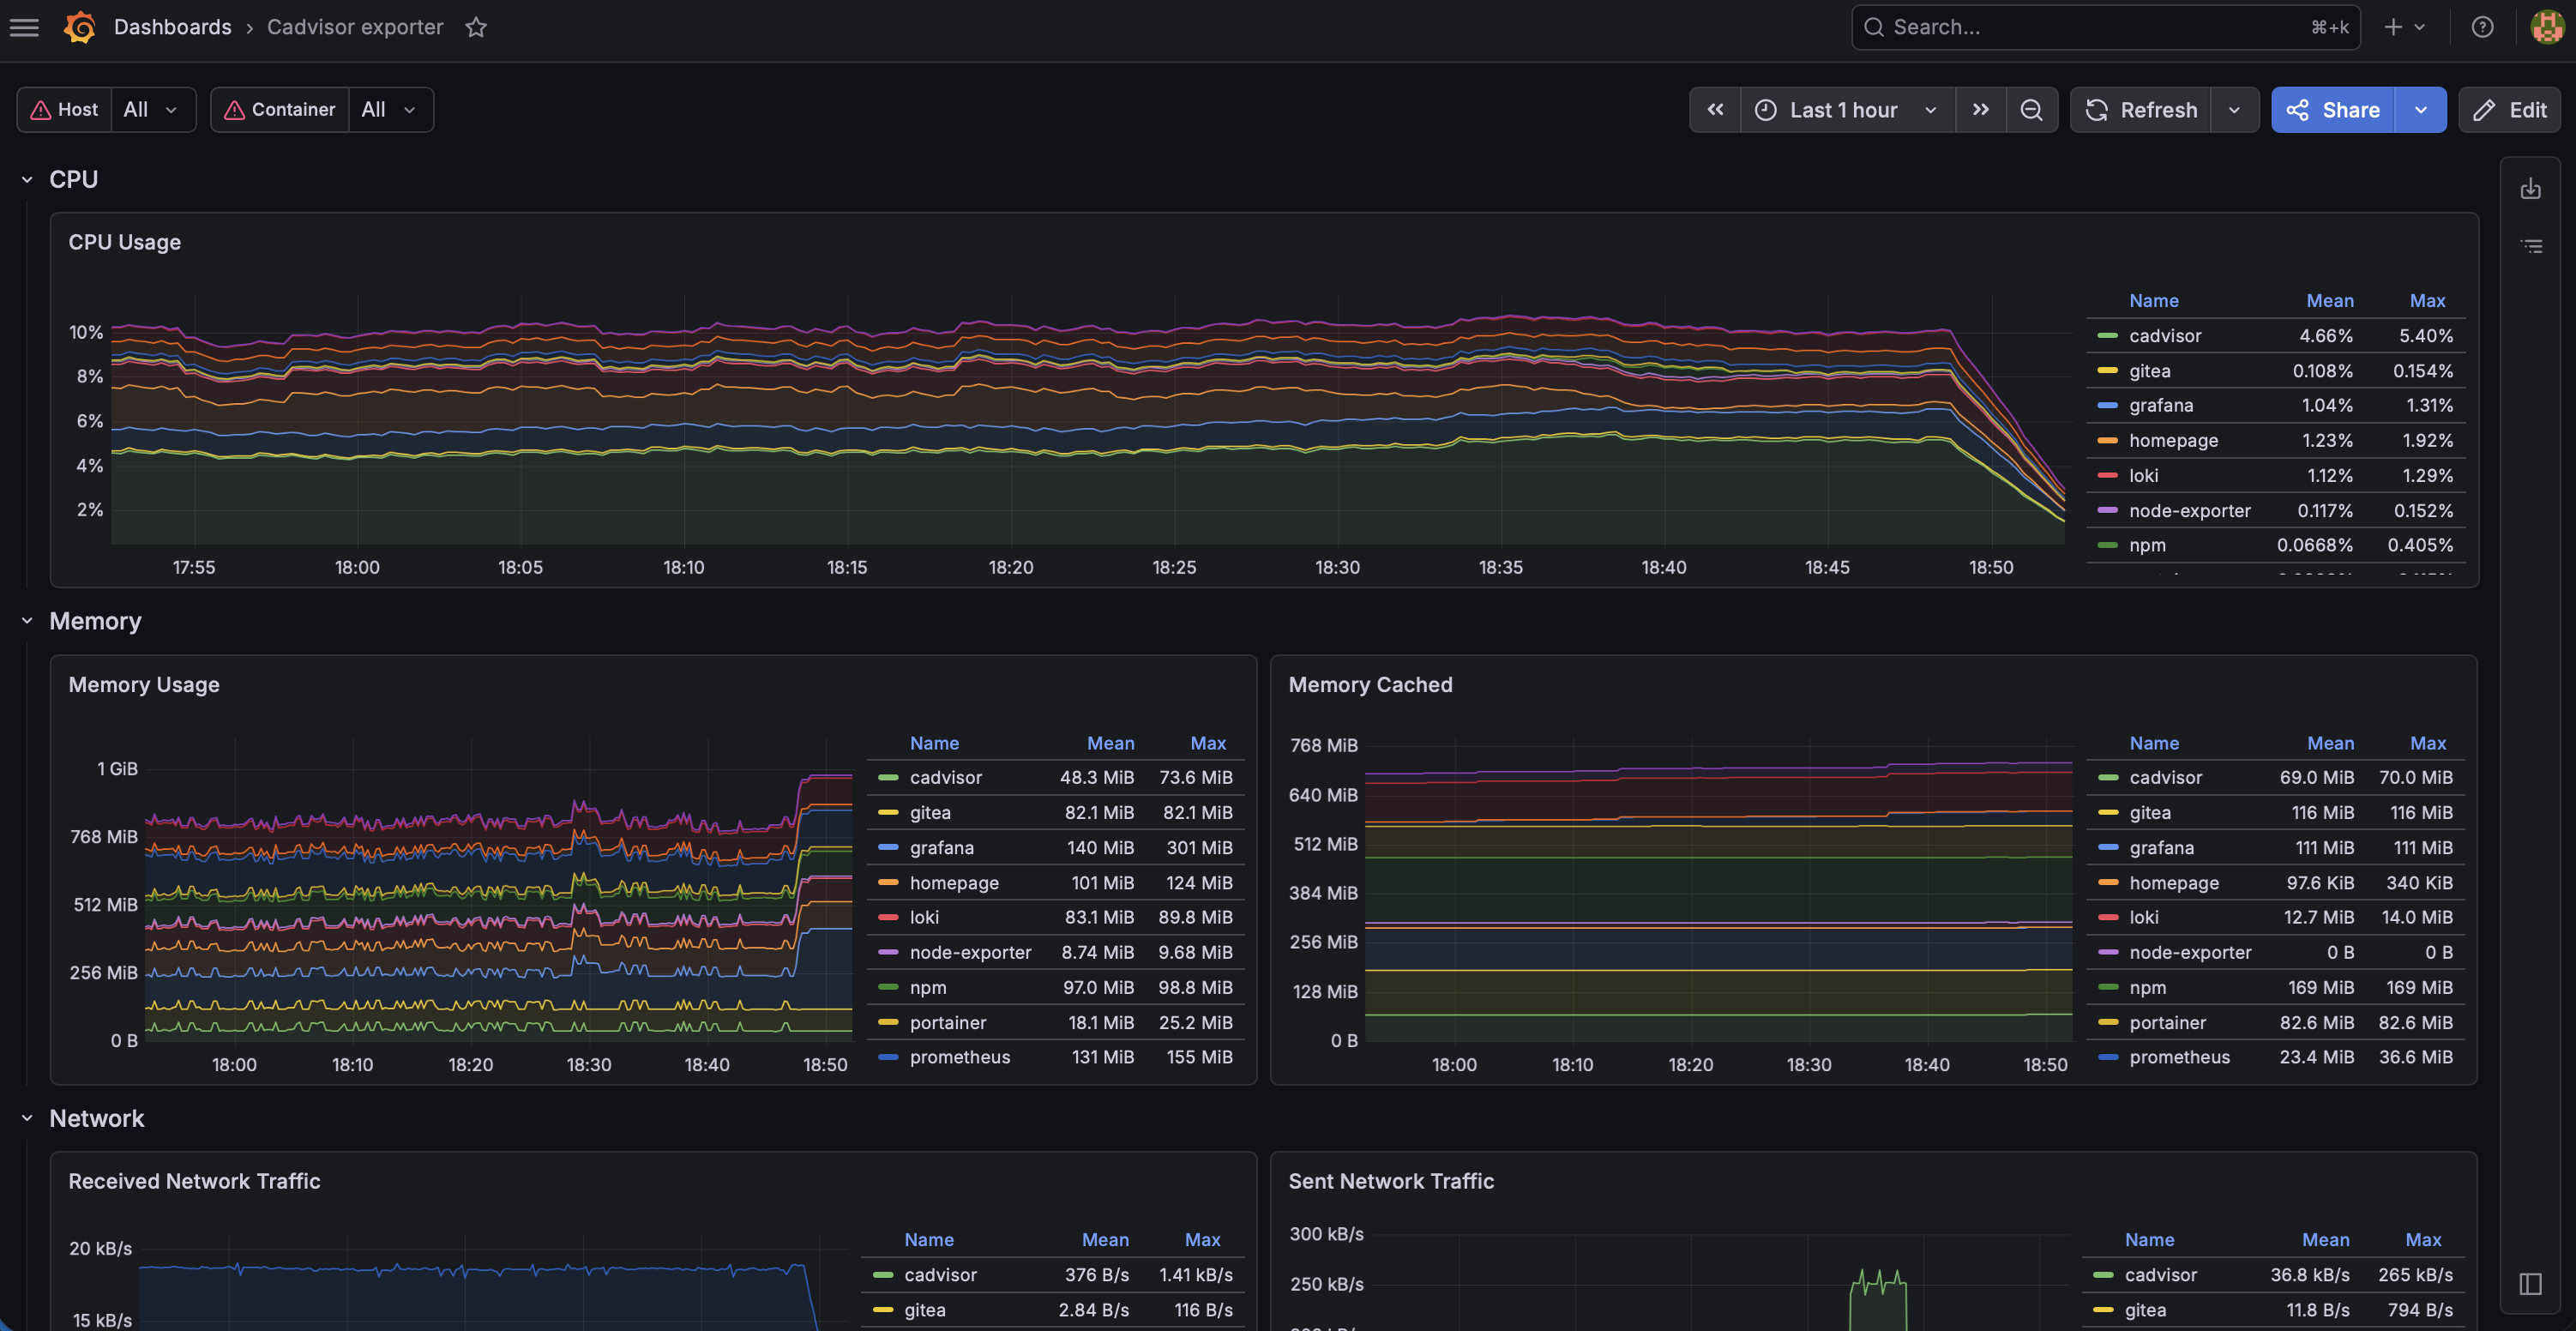
cAdvisor
cAdvisor was added to collect Docker container metrics.
Node Exporter monitors the host, while cAdvisor monitors the containers.
cAdvisor provides visibility into:
- Container CPU usage
- Container memory usage
- Container network traffic
- Container I/O
- Container-level resource consumption
This makes it possible to see which container is using the most resources.
For example:
Gitea memory usage
Grafana CPU usage
Vaultwarden resource usage
Nginx Proxy Manager traffic
The cAdvisor dashboard in Grafana gives a clear view of container behavior.
Discord Alerting
Grafana was connected to Discord using a webhook.
This allows Grafana to send alert notifications directly into a Discord channel.
The workflow is:
Metric or log condition becomes critical
→ Grafana alert rule fires
→ Discord webhook receives message
→ Alert appears in Discord
This makes the lab more realistic because monitoring systems should not only display dashboards. They should notify operators when something goes wrong.
Loki
Loki is the log aggregation system.
It stores logs and allows them to be searched from Grafana.
Prometheus is for numeric metrics.
Loki is for text logs.
Examples of logs:
Container started
Container stopped
Error messages
Warnings
Unauthorized access attempts
Application logs
Loki was added so the lab can support centralized logging.
Promtail
Promtail is the log shipping agent for Loki.
It reads logs from the server and sends them to Loki.
In this project, Promtail reads Docker container logs from:
/var/lib/docker/containers/*/*-json.log
Promtail then forwards them to Loki.
This makes all Docker logs searchable in Grafana.
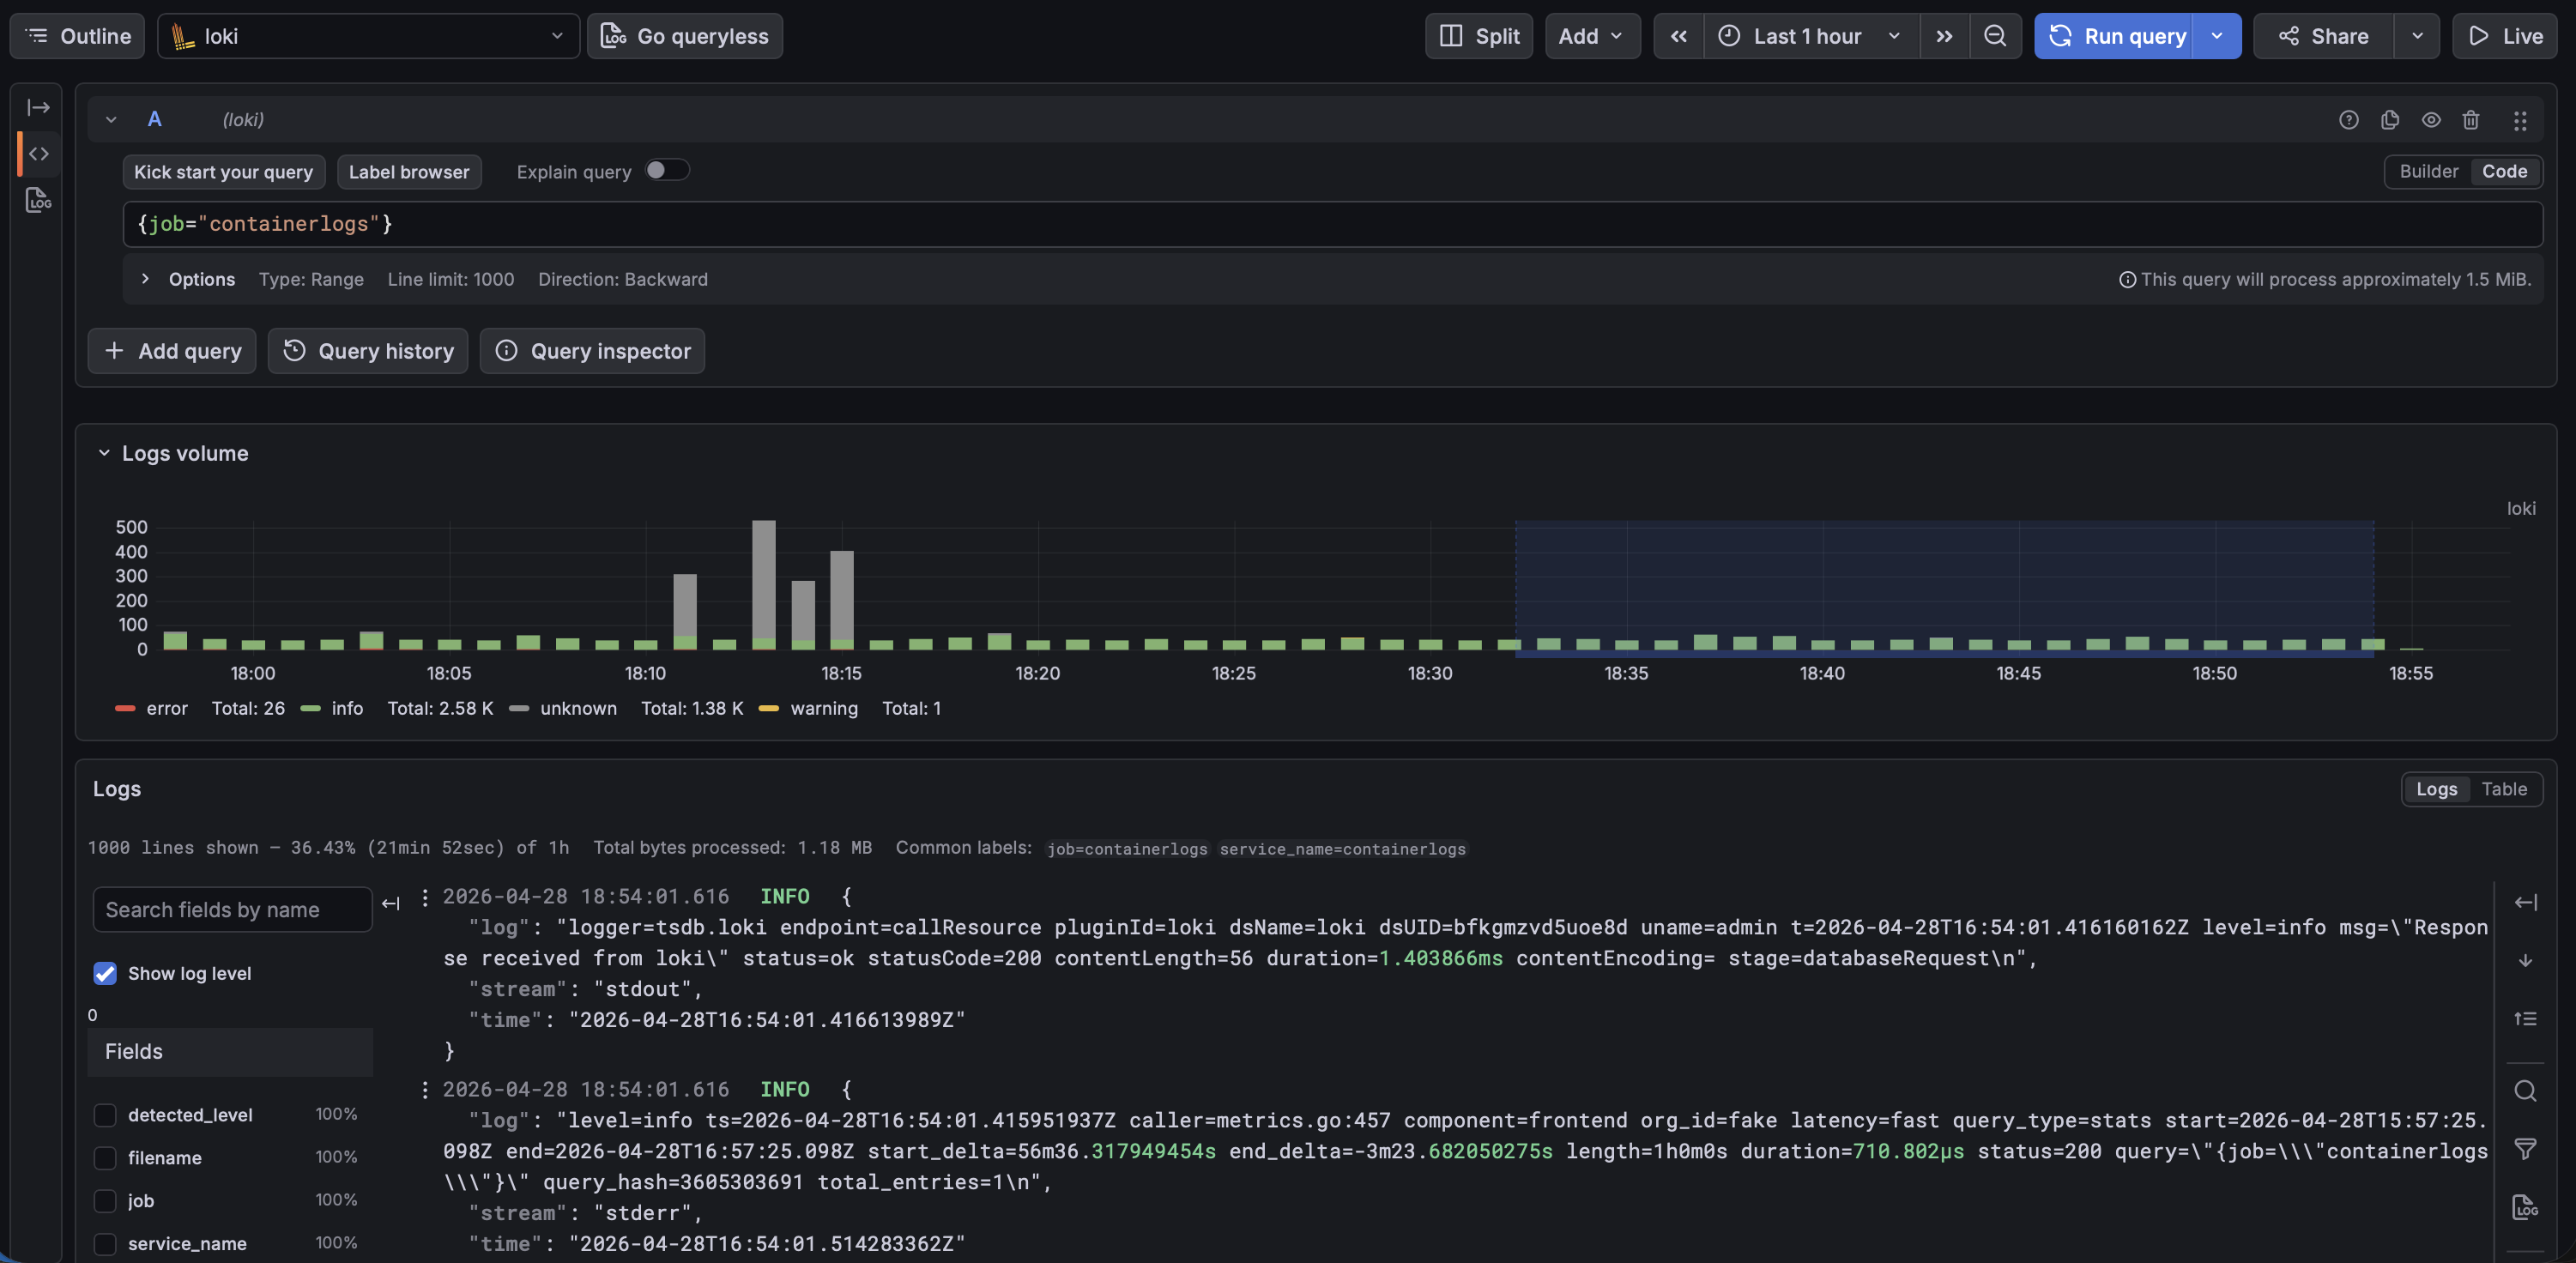
Log Queries
Grafana Explore can query logs from Loki.
Useful queries:
Show all container logs:
{job="containerlogs"}
Show only errors:
{job="containerlogs"} |= "error"
Show warnings:
{job="containerlogs"} |= "warning"
Show unauthorized events:
{job="containerlogs"} |= "unauthorized"
Count errors over time:
count_over_time({job="containerlogs"} |= "error"[5m])
These queries are useful for troubleshooting and basic security monitoring.
Alert Rules
Several alert rules were created in Grafana.
These alerts notify Discord when important problems occur.
High CPU Usage
Triggers when CPU usage is above the configured threshold.
Purpose:
- Detect high CPU load
- Identify performance problems
- React before the server becomes unstable
High RAM Usage
Triggers when memory usage becomes too high.
Purpose:
- Detect memory pressure
- Identify possible memory leaks
- Prevent services from crashing
High Disk Usage
Triggers when root filesystem usage becomes too high.
Purpose:
- Detect storage problems early
- Prevent service failures caused by full disk
- Avoid database or log write issues
Container Error Logs
Triggers when error logs appear in container logs.
Purpose:
- Detect application problems
- Find failed services
- Notice unexpected runtime errors
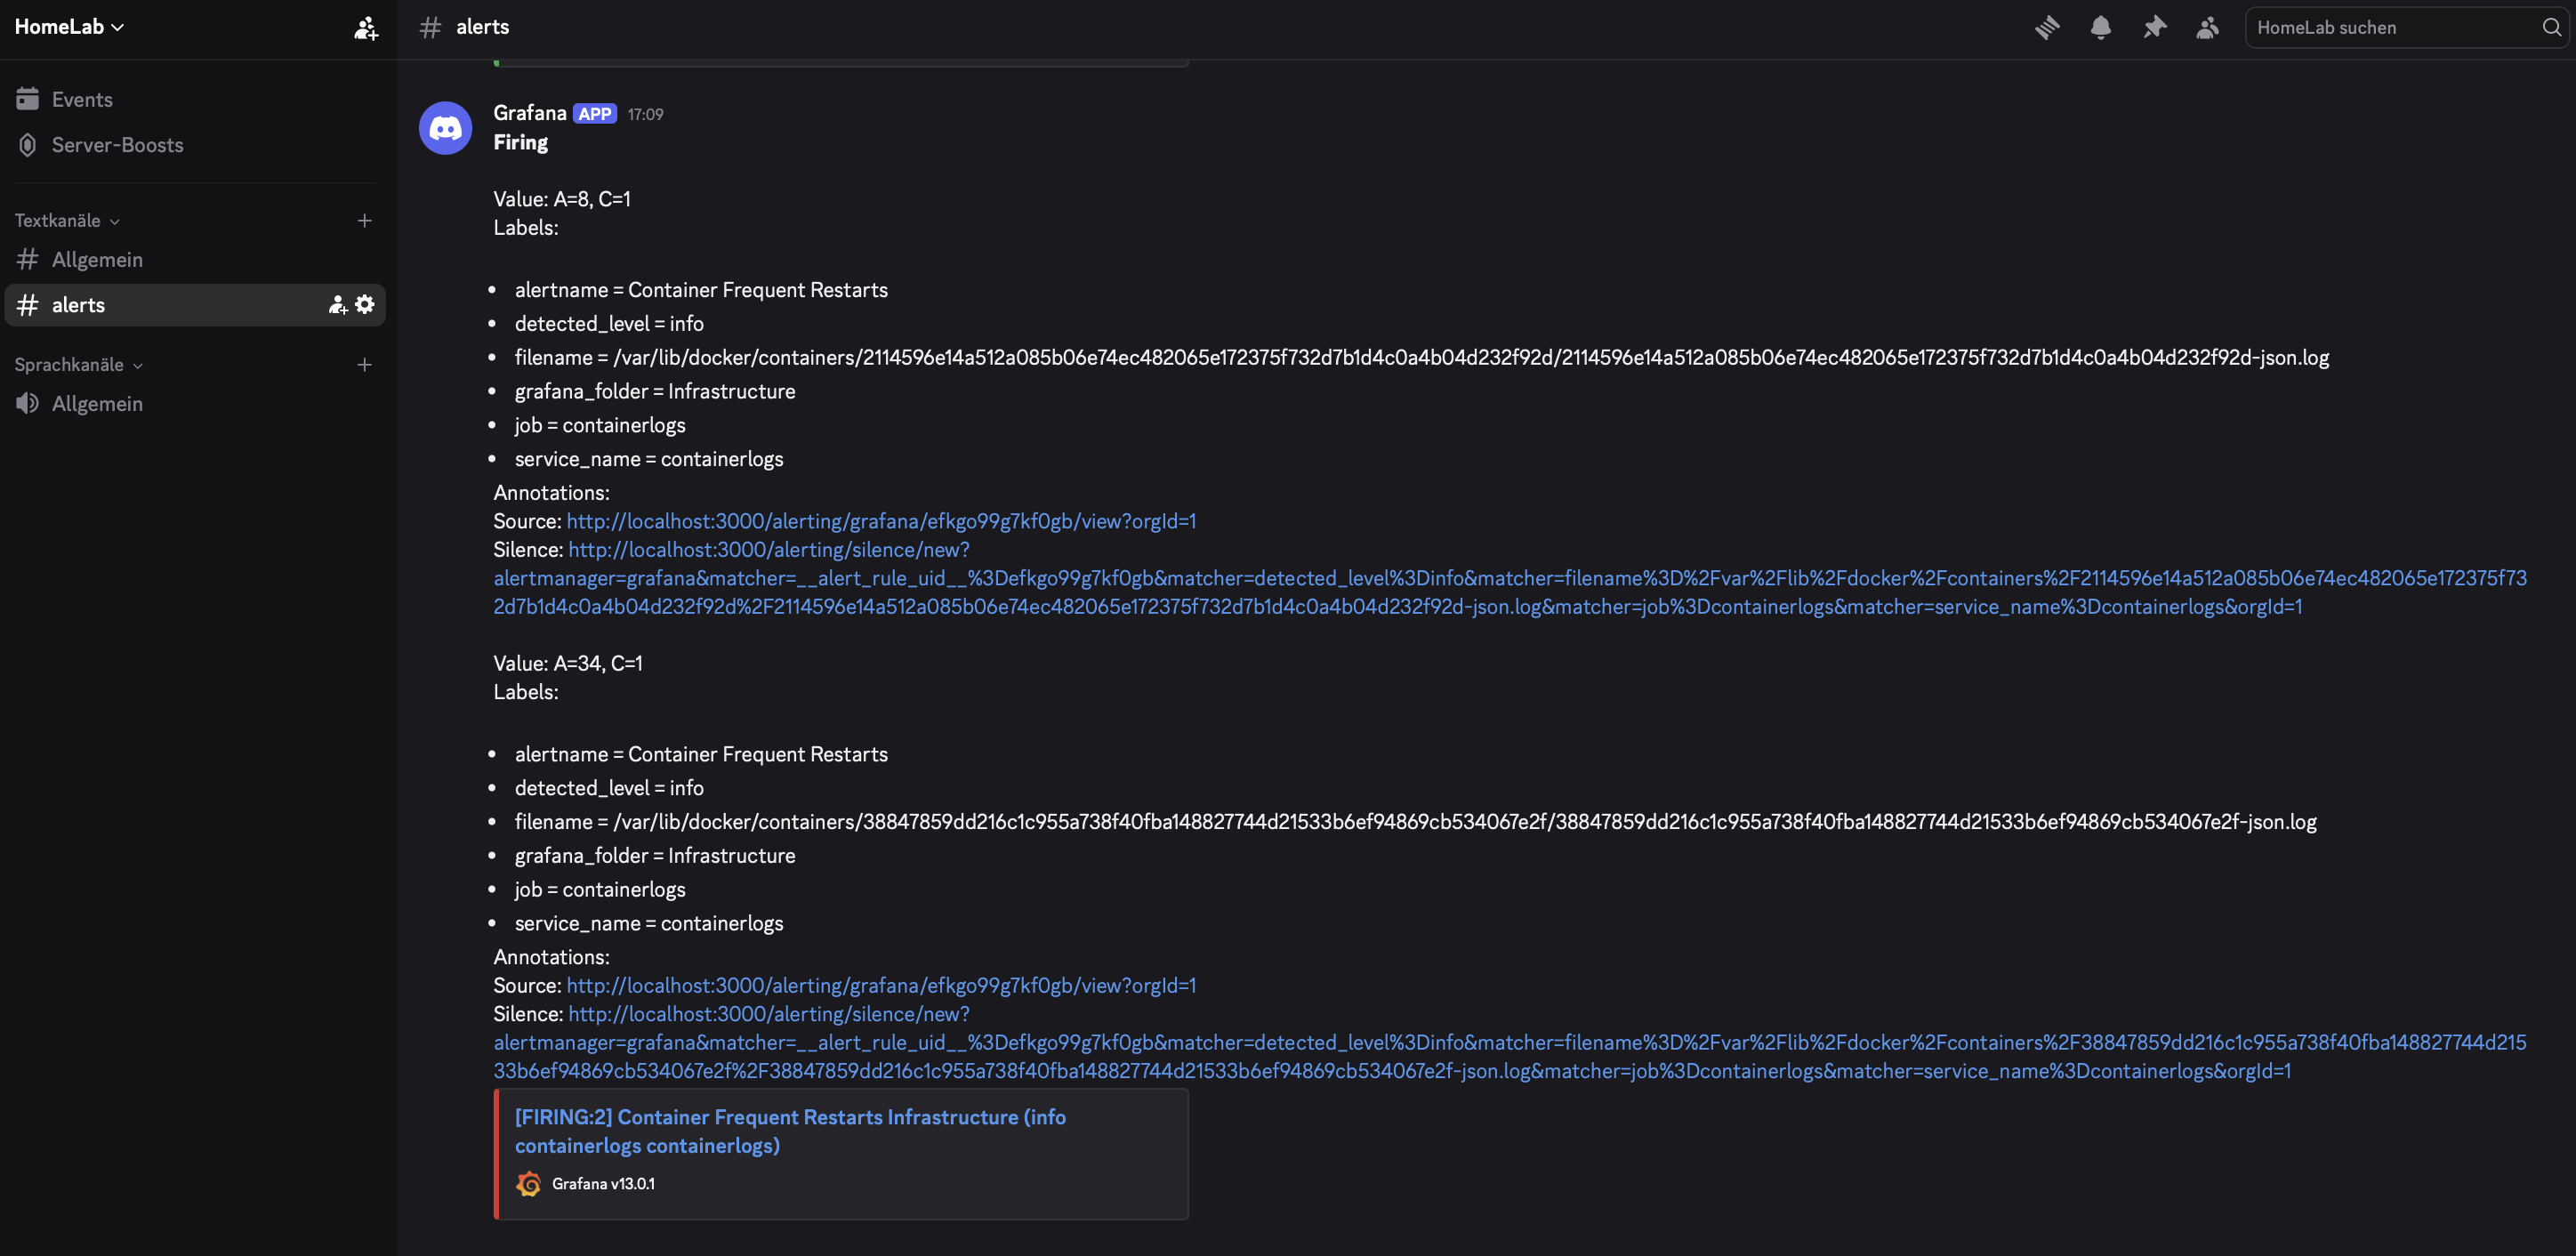
Container Frequent Restarts
Triggers when containers restart frequently.
Purpose:
- Detect unstable containers
- Identify crash loops
- Improve service reliability
Unauthorized Access Attempt
Triggers when logs contain unauthorized access patterns.
Purpose:
- Detect possible authentication issues
- Identify suspicious access attempts
- Add basic security monitoring
No Logs Received
Triggers when no logs are received.
Purpose:
- Detect logging pipeline failures
- Notice if Promtail or Loki stops working
- Ensure observability remains active
Incident Example: Disk Usage Alert
During the project, the High Disk Usage alert actually fired.
Grafana sent a Discord notification because the Ubuntu VM root filesystem reached around 90% usage.
This was a real example of monitoring working correctly.
The issue was investigated with:
df -h
The disk usage showed that the VM had a small disk and Docker images, containers, and logs were using a lot of space.
The issue was fixed by cleaning unused Docker resources:
docker system df
docker system prune -a
After cleanup, disk usage dropped below 60%.
This incident showed the practical value of monitoring and alerting:
- A problem was detected automatically.
- An alert was sent to Discord.
- The system was checked.
- The root cause was identified.
- Cleanup was performed.
- The system returned to a healthy state.
Security Considerations
Even though this project is mainly DevOps-focused, it includes several security-relevant parts.
Security features included:
- Vaultwarden for credential management
- HTTPS for Vaultwarden
- Local certificates with mkcert
- Reverse proxy routing
- Centralized log collection
- Unauthorized access log alerts
- Discord alerting for suspicious events
- Internal-only network exposure
- Docker isolation
What I Learned
Through this project, I practiced and improved skills in several areas.
Linux Administration
- Installing and configuring Ubuntu Server
- Working with services and terminals
- Checking disk usage
- Managing files and permissions
- Understanding system metrics
Docker
- Running containers
- Managing volumes
- Mapping ports
- Using Docker Compose
- Inspecting containers
- Cleaning unused Docker resources
Reverse Proxy
- Routing services through Nginx Proxy Manager
- Using internal hostnames
- Managing proxy hosts
- Working with HTTPS certificates
Monitoring
- Understanding metrics
- Using Prometheus targets
- Installing Node Exporter
- Installing cAdvisor
- Building Grafana dashboards
Logging
- Understanding container logs
- Sending logs with Promtail
- Storing logs in Loki
- Querying logs with LogQL
Alerting
- Creating Grafana alert rules
- Sending alerts to Discord
- Building real operational notifications
- Responding to a disk usage incident
Infrastructure Organization
- Creating a central Homepage dashboard
- Grouping services by purpose
- Making the lab easier to use and document
Conclusion
This project created a complete internal DevOps infrastructure lab using Docker and several self-hosted services.
The lab includes service hosting, reverse proxy routing, password management, Git hosting, uptime checks, metrics monitoring, container monitoring, centralized logs, Discord alerting, and a unified dashboard.
The project demonstrates practical knowledge of:
- Linux server administration
- Docker-based infrastructure
- Reverse proxy configuration
- Monitoring and observability
- Log aggregation
- Alerting and incident response
- Basic security monitoring
- Infrastructure documentation
This lab is intentionally focused and not overloaded. Wazuh and deeper SIEM functionality will be implemented later as a separate security project.