Log Analyzer
A Python-based CLI security tool for analyzing log files, detecting suspicious events, and exporting structured results for further investigation.
This project was built to demonstrate practical Cyber Security, Detection Engineering, and Python scripting skills in a realistic and useful way. The tool can detect suspicious patterns such as failed logins, unauthorized access, SQL injection attempts, XSS payloads, path traversal attempts, server errors, and repeated activity from the same source IP.
The purpose of this project is to simulate a simplified log analysis workflow similar to what is used in real-world security monitoring environments. The tool runs completely in the terminal and is designed to later support a separate SIEM Mini Dashboard project by exporting results as JSON or CSV.
Table of Contents
- Log Analyzer
- Project Overview
- Why This Project Matters
- Features
- Tech Stack
- How It Works
- Prerequisites
- Quickstart
- How to Run the Tool
- Usage
- Reports
- Screenshots
- What Was Implemented and Why
- Security Relevance
- Possible Improvements
Project Overview
This repository contains a Python script called log_analyzer.py that analyzes plain text log files from the command line.
The tool reads a selected log file line by line, extracts useful information such as timestamps and source IP addresses, and checks every line against a set of detection rules. If suspicious activity is found, the script classifies the event, assigns a severity level, and includes it in the final analysis report.
The tool can detect several common security-relevant patterns, including authentication failures, forbidden access attempts, injection payloads, server errors, and repeated failed login attempts from the same IP address.
In addition to terminal output, the tool can also generate:
- a JSON report for structured machine-readable output
- a CSV report for spreadsheet-style review or later processing
- a clear CLI summary for quick manual analysis
Why This Project Matters
Log analysis is an important part of Cyber Security because logs often contain the first signs of suspicious or malicious activity.
A security analyst can use logs to identify:
- failed login attempts
- brute force indicators
- unauthorized access attempts
- web attack payloads
- server-side errors
- suspicious source IP addresses
- repeated abnormal behavior
This project demonstrates how raw log data can be transformed into structured security events. Although this tool is a simplified standalone Python implementation, it follows the same basic idea used in Security Operations Center workflows and SIEM systems.
Features
| Feature | Description |
|---|---|
| Log file analysis | Reads and analyzes plain text log files |
| Failed login detection | Detects failed authentication attempts |
| Brute force indicator | Flags repeated failed logins from the same IP |
| Unauthorized access detection | Detects forbidden or denied access attempts |
| SQL injection pattern detection | Detects common SQL injection indicators |
| XSS pattern detection | Detects common cross-site scripting payloads |
| Path traversal detection | Detects suspicious file path traversal attempts |
| Server error detection | Detects HTTP 500 errors and traceback indicators |
| Severity classification | Classifies events as low, medium, high, or critical |
| Top suspicious IPs | Shows the most active suspicious IP addresses |
| JSON export | Exports full analysis results as JSON |
| CSV export | Exports detected events as CSV |
| Colored CLI output | Improves readability in the terminal |
Tech Stack
| Component | Purpose |
|---|---|
| Python 3 | Main programming language |
argparse | CLI argument parsing |
re | Regex-based detection rules |
json | JSON report export |
csv | CSV event export |
collections.Counter | Counting event types, severities, and IPs |
dataclasses | Structured event and rule objects |
datetime | Analysis timestamp generation |
pathlib | File and path handling |
colorama | Colored terminal output |
How It Works
1. Log File Input
The user provides a log file with the --file option. The tool checks if the file exists and then reads it line by line.
2. Pattern Detection
Each line is checked against multiple detection rules. These rules use regular expressions and keywords to identify suspicious patterns such as failed logins, SQL injection payloads, XSS payloads, path traversal strings, and server errors.
3. Severity Classification
Every detected event receives a severity level:
- low
- medium
- high
- critical
This makes the output easier to understand and helps prioritize suspicious findings.
4. Brute Force Detection
The tool counts failed login attempts per source IP address. If one IP reaches the configured threshold, the tool creates an additional Brute Force Indicator event.
By default, the threshold is set to 5.
5. Exporting Results
The tool can export the analysis results as:
- JSON for structured data and later dashboard usage
- CSV for spreadsheet-style analysis
- terminal output for quick manual review
Prerequisites
Before using the tool, make sure the following software is available:
- Python 3.10 or newer
- pip
- a terminal environment such as macOS Terminal, Linux shell, or VS Code integrated terminal
Optional but recommended:
- a virtual environment
coloramafor colored CLI output
Quickstart
Clone the repository:
git clone <your-repository-url>
Move into the project directory:
cd log-analyzer
Create a virtual environment:
python3 -m venv venv
Activate the virtual environment:
source venv/bin/activate
Install the dependency:
pip install colorama
Run the analyzer:
python3 log_analyzer.py --file sample_logs/sample.log
Export JSON and CSV reports:
python3 log_analyzer.py --file sample_logs/sample.log --json --csv
How to Run the Tool
1. Create a Virtual Environment
python3 -m venv venv
2. Install Dependencies
Activate the environment:
source venv/bin/activate
Install colorama:
pip install colorama
3. Create a Sample Log File
Create the sample log directory:
mkdir sample_logs
Create the sample log file:
touch sample_logs/sample.log
Add test log entries:
2026-04-27 10:15:01 INFO Server started successfully from 192.168.1.10
2026-04-27 10:16:12 WARNING Disk usage is above 80%
2026-04-27 10:17:33 ERROR Internal server error from 192.168.1.20 status 500
2026-04-27 10:18:44 Failed login for user admin from 203.0.113.10
2026-04-27 10:18:49 Failed login for user admin from 203.0.113.10
2026-04-27 10:18:55 Failed login for user admin from 203.0.113.10
2026-04-27 10:19:01 Failed login for user admin from 203.0.113.10
2026-04-27 10:19:07 Failed login for user admin from 203.0.113.10
2026-04-27 10:20:10 Unauthorized access attempt from 198.51.100.23 status 403
2026-04-27 10:21:11 GET /login?id=1 OR 1=1 from 198.51.100.55
2026-04-27 10:22:12 GET /search?q=<script>alert(1)</script> from 198.51.100.77
2026-04-27 10:23:13 GET /download?file=../../etc/passwd from 192.0.2.44
4. Run the Basic Analysis
python3 log_analyzer.py --file sample_logs/sample.log
The tool should display a terminal report with:
- processed log lines
- detected suspicious events
- severity breakdown
- top event types
- top suspicious IP addresses
- recurring error messages
5. Export JSON Results
python3 log_analyzer.py --file sample_logs/sample.log --json
This creates a JSON report in the output directory.
Expected output file:
output/sample_analysis.json
6. Export CSV Results
python3 log_analyzer.py --file sample_logs/sample.log --csv
This creates a CSV report in the output directory.
Expected output file:
output/sample_events.csv
7. Export JSON and CSV Together
python3 log_analyzer.py --file sample_logs/sample.log --json --csv
This creates both export files at the same time.
8. Change the Brute Force Threshold
The default threshold for brute force detection is 5.
Use a stricter threshold:
python3 log_analyzer.py --file sample_logs/sample.log --threshold 10
Use a more sensitive threshold:
python3 log_analyzer.py --file sample_logs/sample.log --threshold 3
Usage
Analyze a Log File
python3 log_analyzer.py --file sample_logs/sample.log
Export JSON Output
python3 log_analyzer.py --file sample_logs/sample.log --json
Export CSV Output
python3 log_analyzer.py --file sample_logs/sample.log --csv
Use a Custom Output Directory
python3 log_analyzer.py --file sample_logs/sample.log --json --csv --output-dir reports
Change the Brute Force Threshold
python3 log_analyzer.py --file sample_logs/sample.log --threshold 3
Limit Top Results
python3 log_analyzer.py --file sample_logs/sample.log --top 3
Reports
The tool can produce the following outputs:
| Report Type | Purpose |
|---|---|
| Terminal output | Quick analysis directly in the console |
| JSON report | Structured export for later processing or dashboard integration |
| CSV report | Spreadsheet-friendly list of detected events |
The JSON export is especially useful for a future SIEM-style dashboard, because it contains structured event data that can be parsed and visualized.
Screenshots
The following screenshots can be added to document the tool and demonstrate its functionality.
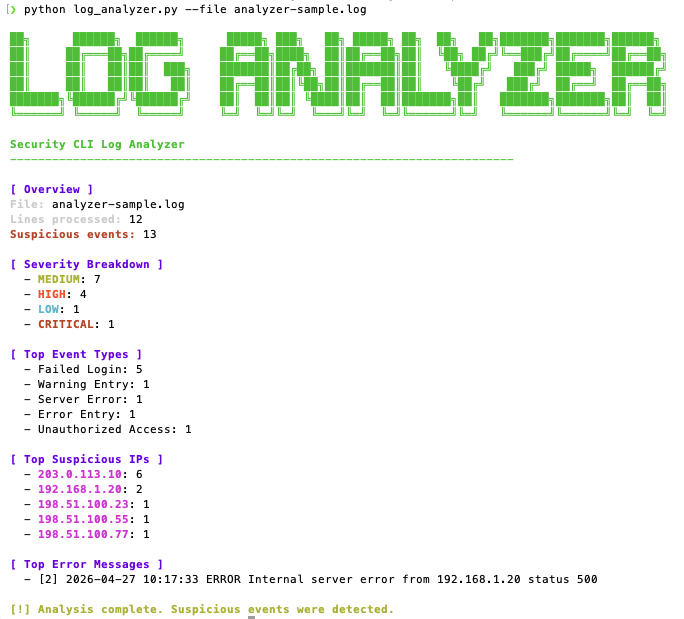
1. Basic Log Analysis
Shows the basic CLI command and terminal output after analyzing a sample log file.
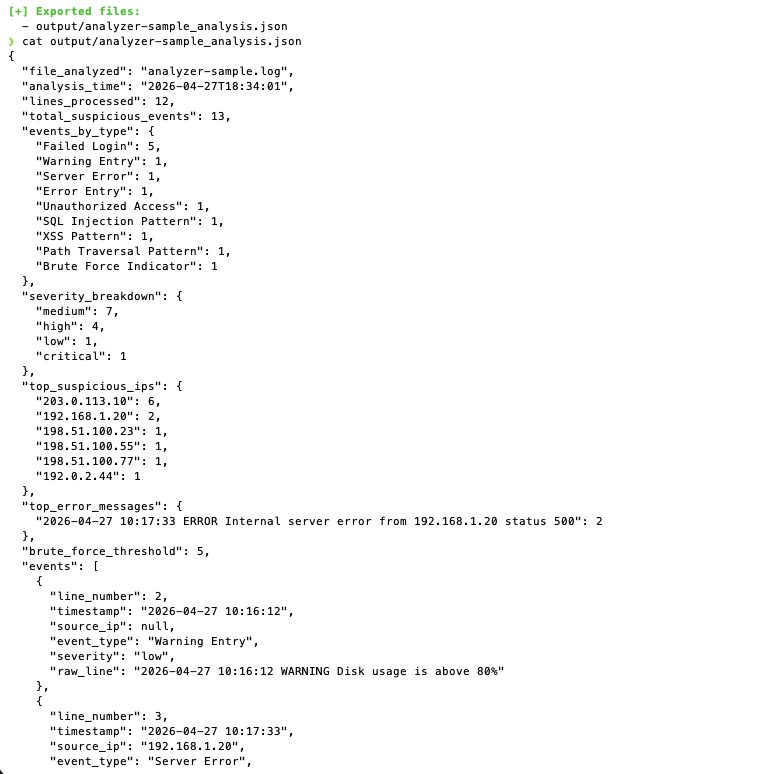
2. JSON Output
Shows the generated JSON analysis file after running the tool with the --json option.
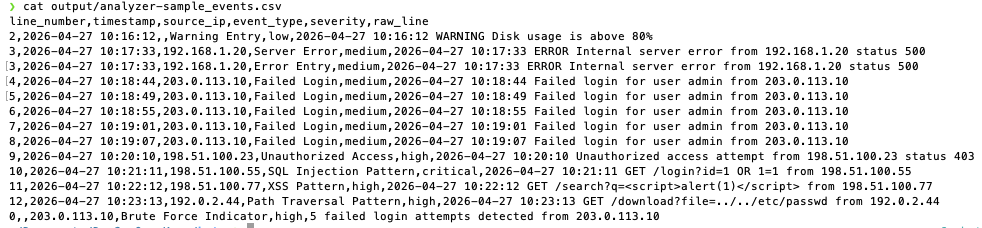
3. CSV Output
Shows the generated CSV event file after running the tool with the --csv option.
What Was Implemented and Why
CLI-based workflow
Implemented so the tool can be used directly from the terminal without a graphical interface.
Regex-based detection rules
Implemented to detect suspicious log entries using clear and understandable patterns.
IP address extraction
Implemented to identify source IP addresses and highlight repeated suspicious activity.
Timestamp extraction
Implemented to preserve time information from matching log entries where possible.
Severity classification
Implemented to make findings easier to prioritize.
Brute force indicator
Implemented to detect repeated failed login attempts from the same IP address.
JSON export
Implemented so the results can later be consumed by a SIEM-style dashboard or another analysis tool.
CSV export
Implemented to provide a simple structured format for review, documentation, or spreadsheet analysis.
Colored terminal output
Implemented to improve readability and make important findings easier to notice.
Security Relevance
This project demonstrates important security concepts such as:
- log analysis
- detection engineering
- event classification
- brute force detection
- suspicious IP identification
- regex-based security detection
- structured security reporting
- preparation of data for SIEM-style visualization
Possible real-world use cases include:
- reviewing authentication logs
- identifying repeated failed login attempts
- detecting suspicious web requests
- finding possible injection attempts
- analyzing server error patterns
- preparing log data for dashboards or incident reports
Possible Improvements
Possible future improvements for this project include:
- support for multiple log formats
- Apache and Nginx log parsing profiles
- SSH authentication log parsing
- Windows event log import
- custom user-defined detection rules
- YAML-based rule configuration
- HTML report generation
- alert scoring system
- timeline visualization
- integration with the future SIEM Mini Dashboard
- packaging the tool as an installable CLI utility