SIEM Mini Dashboard
A browser-based security dashboard for visualizing suspicious events generated by a Python CLI Log Analyzer.
This project was built to demonstrate practical Cyber Security, Detection Engineering, Security Monitoring, Data Visualization, and Frontend Development skills in a realistic portfolio project.
The dashboard consumes structured JSON data exported by the custom log-analyzer.py tool and transforms raw security findings into an interactive SIEM-style monitoring interface with KPIs, charts, filters, timelines, and searchable event tables.
It simulates how security teams review alerts, investigate suspicious IP activity, prioritize critical findings, and gain visibility into log data through a centralized dashboard.
Table of Contents
- SIEM Mini Dashboard
- Project Overview
- Why This Project Matters
- Features
- Tech Stack
- Architecture
- How It Works
- Prerequisites
- Quickstart
- How to Run the Dashboard
- Usage
- Screenshots
- Security Relevance
- Possible Improvements
- Author
Project Overview
This repository contains a lightweight SIEM-style dashboard built with HTML, CSS, and Vanilla JavaScript.
The dashboard reads structured JSON data created by the Python Log Analyzer and displays:
- total suspicious events
- severity distribution
- critical and high-priority alerts
- top suspicious source IPs
- most common event types
- searchable event records
- filterable security findings
- timeline of recent events
The purpose of the project is to simulate the workflow of a small Security Operations Center (SOC) dashboard without requiring heavy enterprise tooling.
Why This Project Matters
Security teams rely on dashboards to transform raw logs into actionable intelligence.
Without visualization, logs are difficult to review manually. With a dashboard, analysts can quickly:
- identify brute force activity
- detect suspicious IP addresses
- prioritize critical events
- monitor attack trends
- investigate incidents faster
- search large event lists
- communicate findings clearly
This project demonstrates the practical bridge between log analysis and security monitoring dashboards.
Features
| Feature | Description |
|---|---|
| KPI Overview Cards | Displays key metrics such as total events, critical alerts, unique IPs |
| Severity Chart | Shows event distribution by severity |
| Event Type Chart | Shows most common detection categories |
| Suspicious IP Chart | Highlights top source IP addresses |
| Search Function | Search events by raw log line, IP, or type |
| Severity Filter | Filter events by critical, high, medium, low |
| Event Type Filter | Filter by detection rule |
| Source IP Filter | Filter by IP address |
| Event Table | Detailed list of detected events |
| Timeline View | Shows latest suspicious events |
| Refresh Button | Reload JSON data |
| Reset Filters | Restore default dashboard state |
| Responsive Layout | Works on desktop and smaller screens |
| Dark Security Theme | Professional SIEM-inspired visual style |
Tech Stack
| Component | Purpose |
|---|---|
| HTML5 | Dashboard structure |
| CSS3 | Styling, layout, responsiveness |
| Vanilla JavaScript | Data loading and rendering |
| Chart.js | Interactive charts |
| Python Log Analyzer | JSON data source |
| JSON | Structured event exchange format |
Architecture
Raw Logs
   ↓
Python Log Analyzer
   ↓
sample_analysis.json
   ↓
SIEM Mini Dashboard
   ↓
Charts • KPIs • Table • Timeline
This demonstrates a realistic detection pipeline:
- collect logs
- analyze logs
- classify findings
- export structured data
- visualize findings
How It Works
1. Log Analyzer Export
The companion Python tool analyzes raw logs and exports JSON output:
python3 log_analyzer.py --file enterprise_sample.log --json
2. Dashboard Loads JSON
The browser loads:
data/sample_analysis.json
3. JavaScript Processes Events
The dashboard extracts:
- event severities
- source IP counts
- event types
- timeline data
- metadata
4. Visual Output
The user receives:
- charts
- tables
- KPIs
- filters
- timeline view
Prerequisites
Before using the dashboard, make sure the following is available:
- modern browser such as Chrome, Edge, Firefox, or Safari
- Python 3 for the local web server
- exported JSON data from the Log Analyzer
Quickstart
Clone repository:
git clone <your-repository-url>
Enter project folder:
cd siem-mini-dashboard
Start local server:
python3 -m http.server 3003
Open browser:
http://localhost:3003
How to Run the Dashboard
1. Generate JSON Data
python3 log_analyzer.py --file enterprise_sample.log --json
2. Copy JSON File
Move exported file into:
data/sample_analysis.json
3. Start Local Web Server
python3 -m http.server 3003
4. Open in Browser
http://localhost:3003
Usage
Search Events
Use the search bar to search for:
- SQL injection
- IP addresses
- failed login
- XSS
- path traversal
Filter Severity
Use the severity dropdown to filter by:
- Critical
- High
- Medium
- Low
Filter Event Type
Show only specific event types such as:
- Failed Login
- SQL Injection Pattern
- XSS Pattern
- Unauthorized Access
- Brute Force Indicator
Filter by IP
Focus on one suspicious source host by selecting a specific IP address.
Refresh Dashboard
Reload the newest JSON data after the analyzer output has been updated.
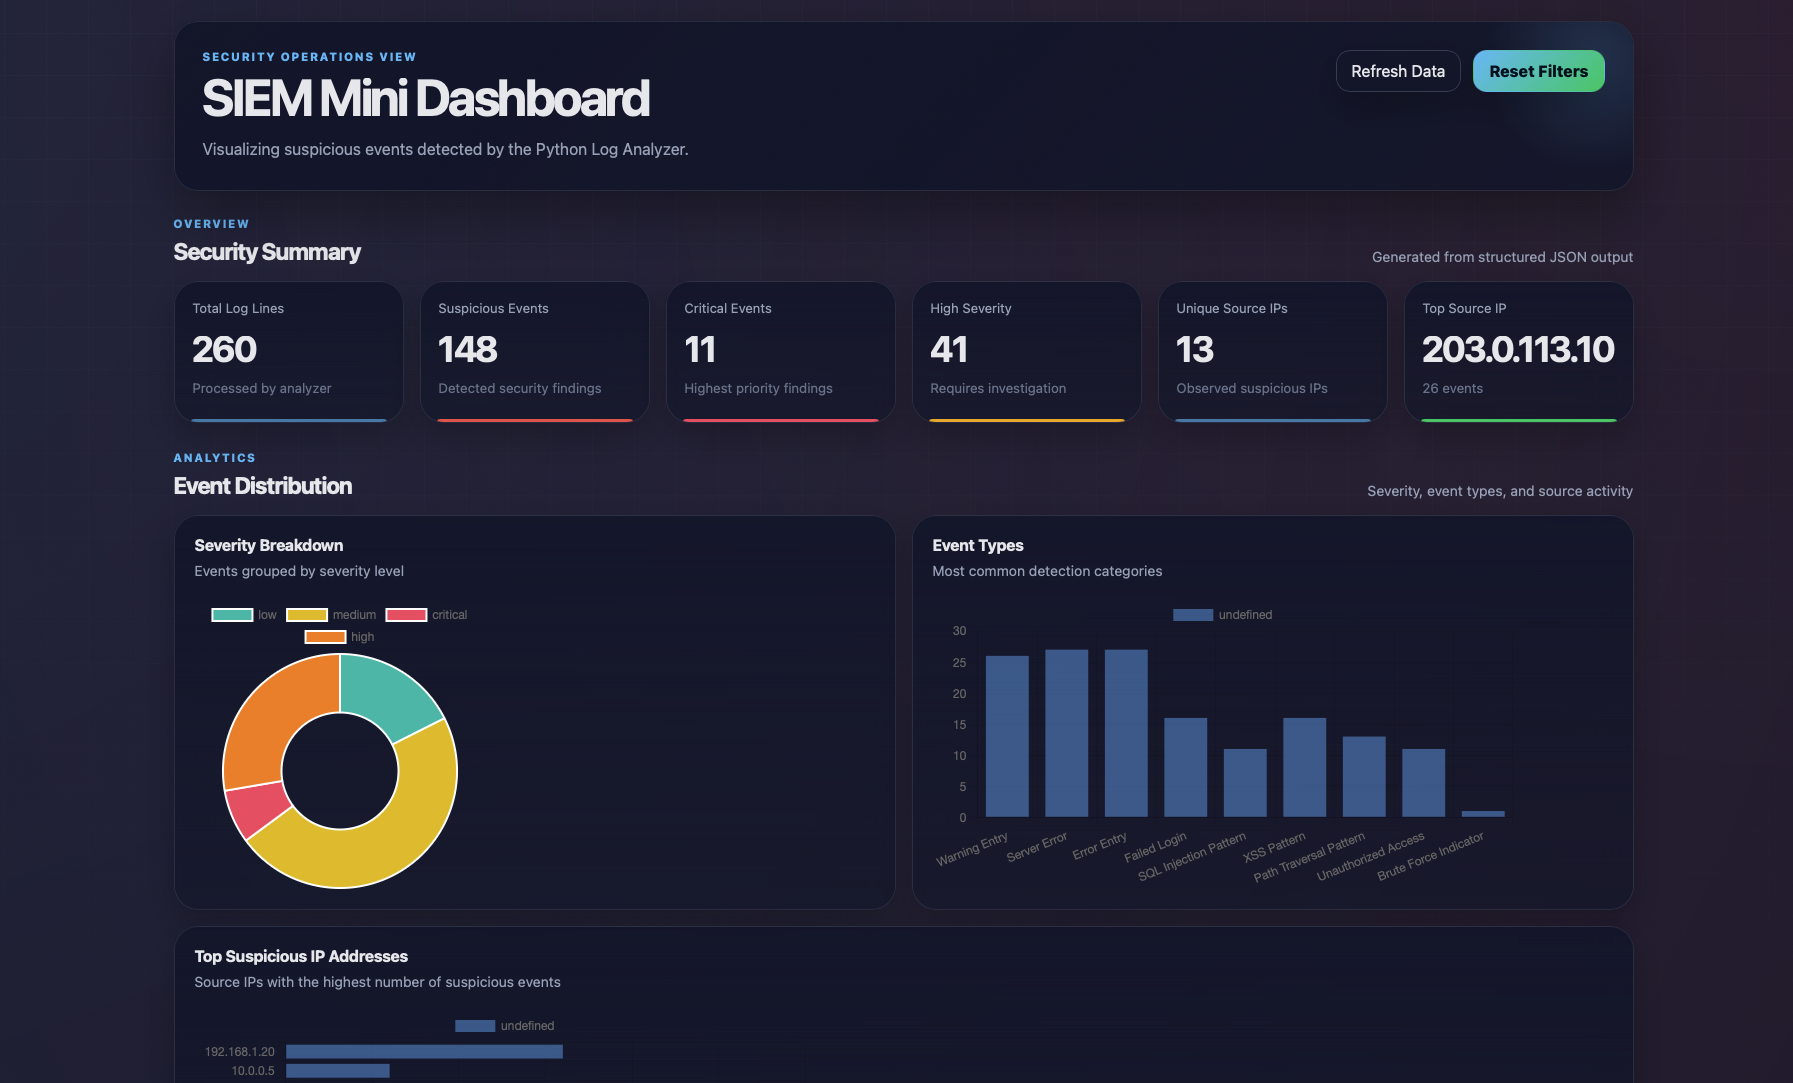
Screenshots
1. Full Dashboard Overview
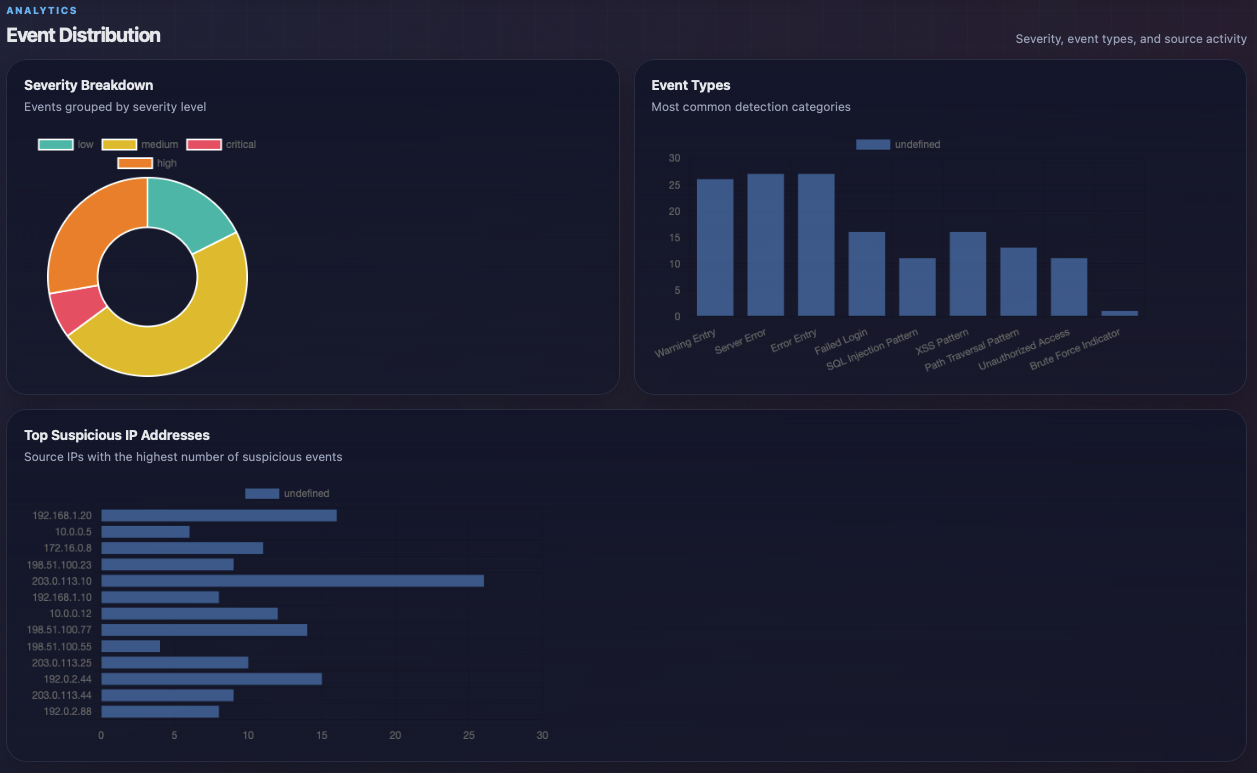
2. Analytics Charts
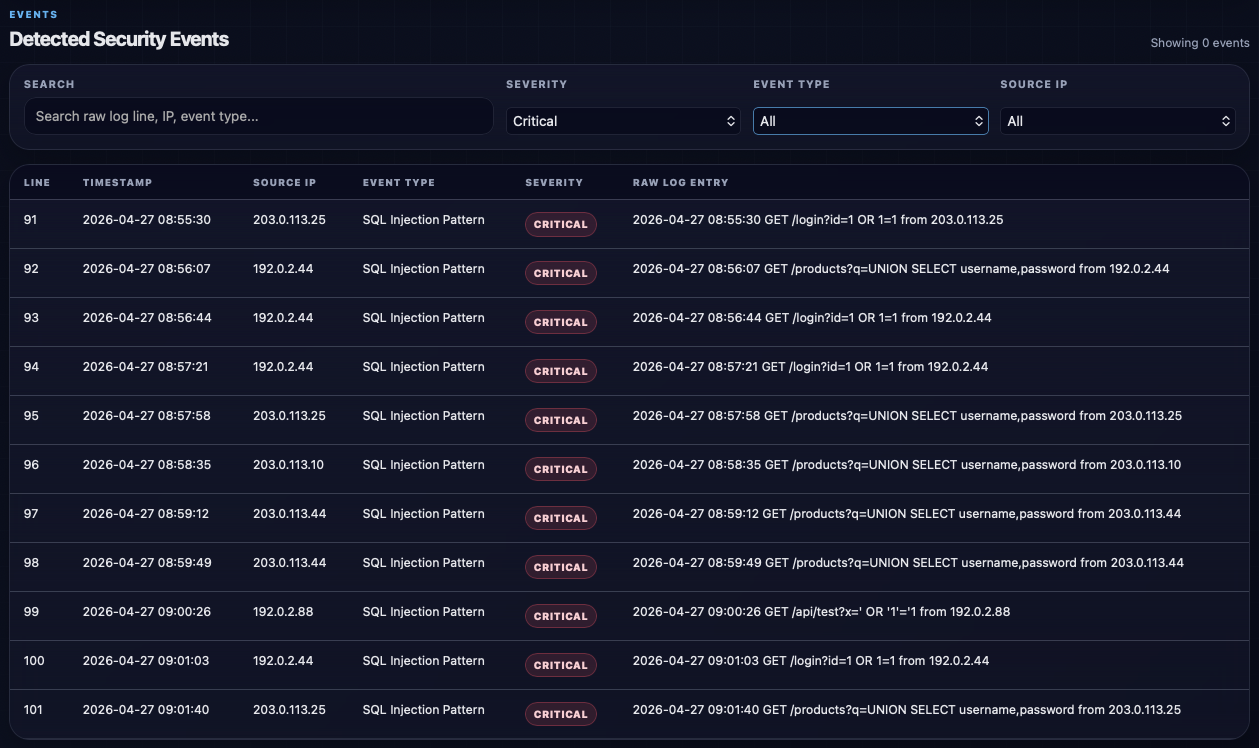
3. Filtered Events Table
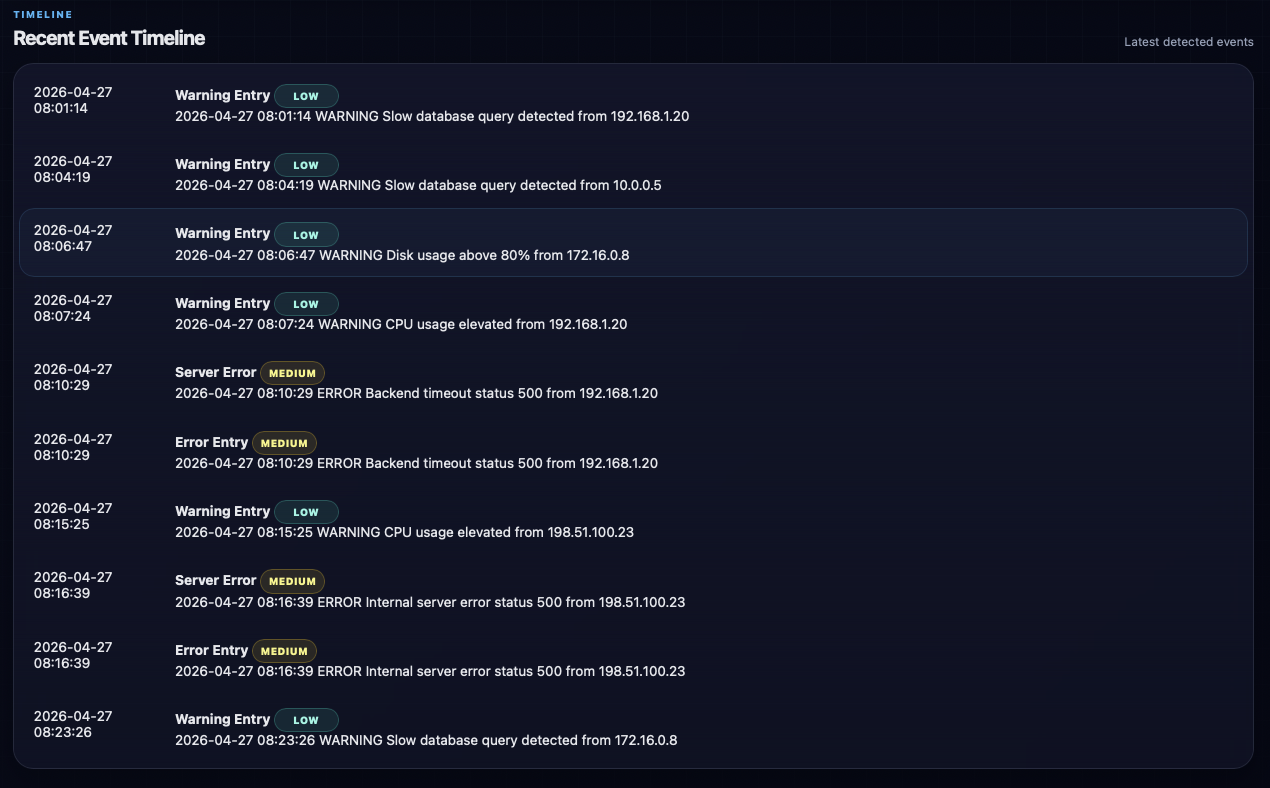
4. Event Timeline
5. JSON Data Source
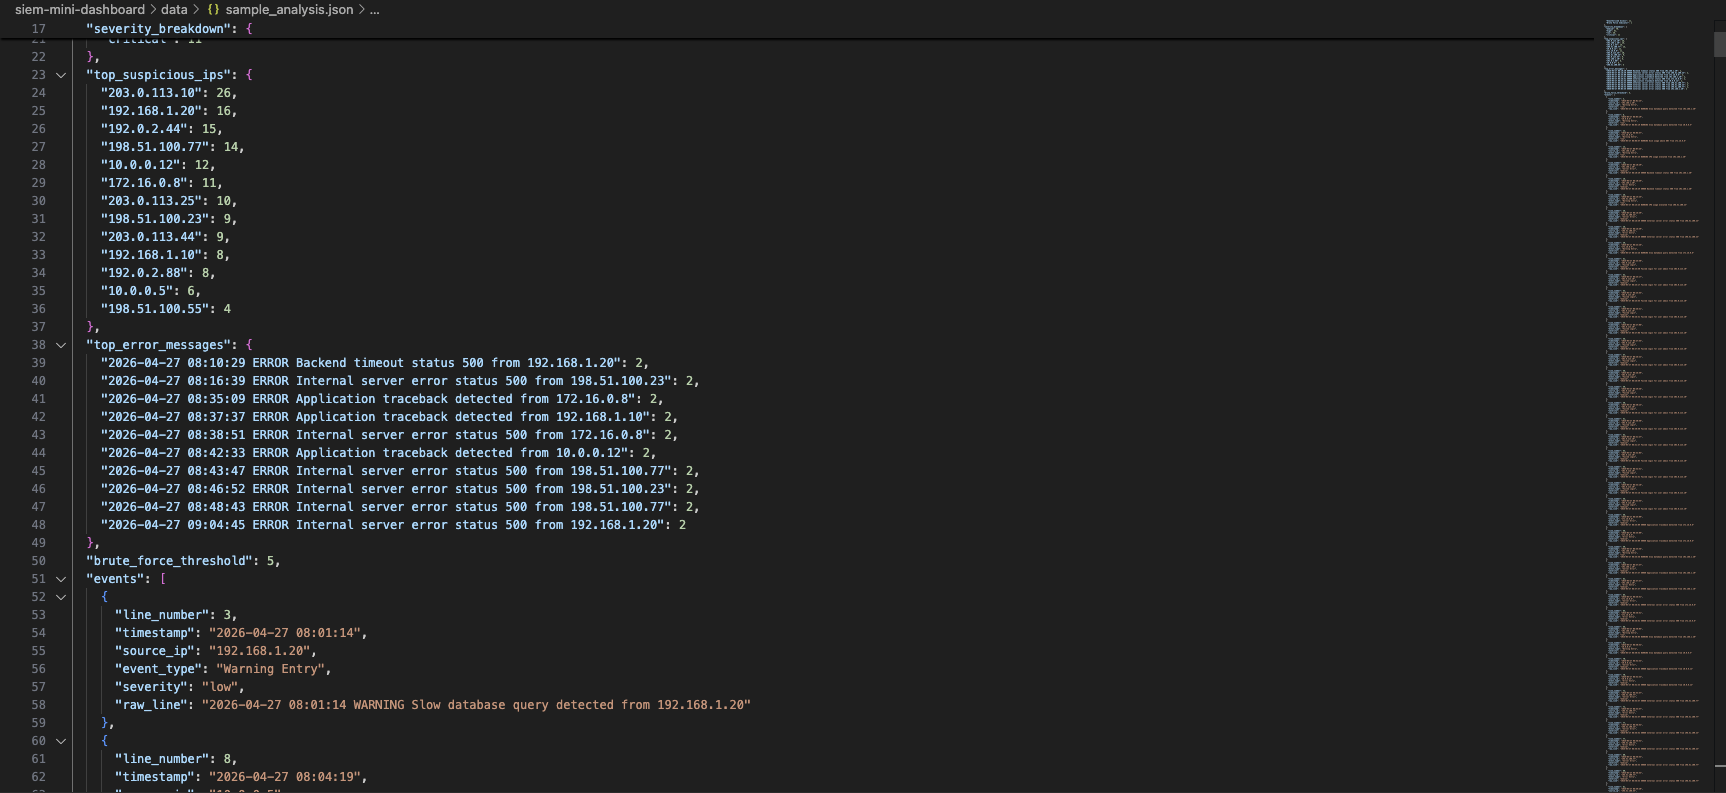
Security Relevance
This project demonstrates practical security concepts such as:
- SIEM fundamentals
- security monitoring
- log visibility
- event prioritization
- suspicious IP tracking
- detection engineering
- dashboarding for SOC workflows
- incident investigation support
- alert triage
Possible real-world use cases include:
- internal lab monitoring
- incident response practice
- analyst training
- dashboard prototypes
- log visualization layer for custom tooling
Possible Improvements
Possible future improvements include:
- live auto-refresh mode
- multiple JSON data sources
- drag and drop log import
- CSV import support
- PDF reporting
- analyst notes
- alert acknowledgement system
- MITRE ATT&CK mapping
- geolocation for IP addresses
- email or Slack alerts
- authentication system
- backend API with Flask or FastAPI
- dark/light mode toggle
- export filtered results
- integration with real syslog sources
Author
Ognjen Manojlovic